


In our previous post, we presented evidence suggesting that labor market indicators provide the most reliable information for dating the U.S. business cycle. In this post, we further develop the case. In fact, the unemployment rate has provided an almost perfect record of distinguishing the beginning of recessions in the post-war U.S. economy. We also show that using more granular labor market data, such as by region or industry, also provides valuable information about the state of the business cycle.
The most natural starting point for employing labor market variables is the unemployment rate. It has advantages of being timely and only minimally revised; however, the unemployment rate is typically not used for business cycle dating by the NBER business cycle dating committee (BCDC). As the committee has explained, the metric is both a leading and lagging indicator:
“[The BCDC] considers economic activity, which grows along an upward trend. As a result, the unemployment rate often rises before the peak of economic activity, when activity is still rising but below its normal trend rate of increase. Thus, the unemployment rate is often a leading indicator of the business-cycle peak. […] On the other hand, the unemployment rate often continues to rise after activity has reached its trough. In this respect, the unemployment rate is a lagging indicator.”
The top panel of the chart below shows the unemployment rate (blue line) along with the NBER recessions (blue shading) and the recessions implied by the Bry-Boschan (BB) algorithm (pink shading) based on current unemployment rate data (a methodology described in depth in our companion post). The BB algorithm applied to the unemployment rate dates the peaks earlier and troughs later as compared to NBER recessions (top panel). The bottom panel reproduces this dating exercise for each vintage unemployment series, with the y-axis representing the years available. If we look horizontally for a chosen vintage, red (gray) shading indicates periods of recession (expansion) based on the BB algorithm and those vintage data. We observe a similar encompassing of the NBER recessions using real-time data. Interestingly, the BB algorithm detects a cycle around the mid-1960s that was not identified by the BCDC. Milton Friedman (Friedman 1970) argued that this period should have been designated a recession.

Our analysis suggests that business cycle dating using the unemployment rate may be better implemented using “threshold rules.” A threshold rule exploits the empirical regularity that the unemployment rate tends to either rise or fall—and only very rarely moves sideways (as evident in the top panel of the chart above). Thus, once it rises “enough” we observe a continued sharp increase which has historically coincided with U.S. recessions.
Threshold rules for the unemployment rate have been used by private-sector forecasters and policymakers for many years (see, for example, the 30-basis-point thresholds advocated by former New York Fed President Dudley in 2001, former Chair Bernanke in 2006, or former Richmond Fed President Lacker in 2008). This idea has been formalized in Stock and Watson (2010), Hatzius and Stehn (2012), and Sahm (2019). Our approach follows Hatzius and Stehn (2012).
We first filter the (unrounded) unemployment rate by taking three-month moving averages to reduce noise, and then subtract the most recent local minimum (prior twelve-months) from the current three-month moving average. The top panel of the chart below shows the evolution of this measure against NBER-dated recessions. The threshold line shows a value of 35 basis points as advocated by Hatzius and Stehn (2012). As it can be seen, NBER-dated peaks are well-proxied by times when the filtered unemployment rate crosses the 35-basis-point threshold from below. This is further illustrated in the middle panel that overlays threshold-based recession dating on the NBER-dating. The threshold approach is an improvement relative to the BB rule (as is obvious in a comparison to the top panel of the chart above). Since the unemployment rate is not revised much, this rule is reliable and stable even in real time (see the bottom panel of chart below).

At first glance, the threshold rule may appear ad hoc—especially the choice of cutoff. Instead we argue that it is quite reasonable. In fact, Okun’s law provides a neat reconciliation of the threshold rule on unemployment and the local maxima in real GDP. The “difference version” of Okun’s law is: Δyt = k − cΔut where Δyt is real GDP growth, Δut is the change in the unemployment rate and k and c are positive numbers; thus, an increase in the unemployment rate is associated with a decline in output only if Δut >k⁄c. This explains why it is important to move to a threshold rule for dating with the unemployment rate. Using estimated values of k and c based on Okun’s law over our sample, we obtain a threshold value of around 50 basis points—very close to the choice of Hatzius and Stehn (2012).
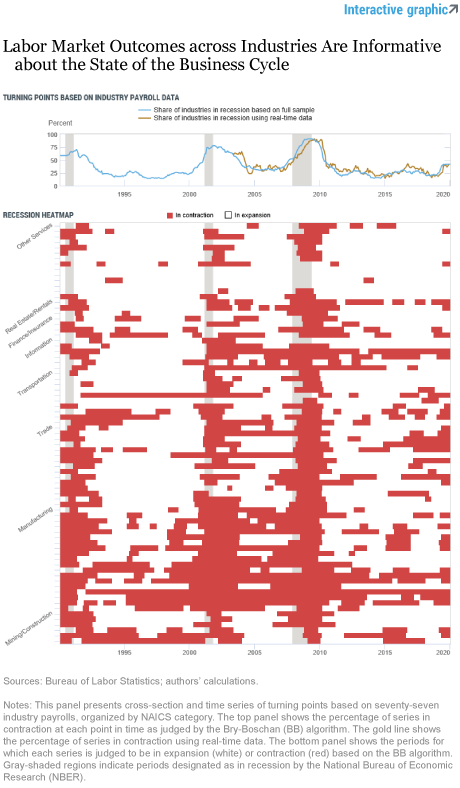
Although the aggregate unemployment rate performs impressively based on the results in our first post, it is natural to investigate whether cross-sectional information can further refine the signal from the labor market. We first explore the signal coming from different industries in the economy. We use the cross section of private payrolls from the Establishment Survey across seventy-seven industries (defined by their three-digit NAICS codes). We apply the BB algorithm to each of these payroll series and calculate the cross-sectional share of industries in contraction. The blue line in the interactive chart below shows the time series based on the full sample; the gold line shows the real-time value for each month based on a recursive application of the BB algorithm using real-time data series. Even with real-time data, we observe a sharp rise leading into the recession of the share of industries in recession. Currently, the measure is at levels similar to the 2015-16 period, and below levels observed leading into the previous recession.
The heatmap in the bottom panel of the chart below shows in each row industry payroll employment grouped by the respective two-digit NAICS code, with red pixels identifying months of contraction based on the BB algorithm. The most informative sector for business cycle fluctuations appears to be the “other services,” along with wholesale and retail trade. In contrast, the manufacturing sector experiences frequent and persistent cycles that are not associated with aggregate fluctuations. This observation paired with our discussion of the divergence between manufacturing and the broader economy in the 2014-16 period from our previous post
reinforces our argument that manufacturing data may be overly relied upon for assessing the state of the business cycle.
We may also investigate the geographic variation of local labor markets. As noted for the national unemployment rate, the threshold approach performs better than the BB algorithm at capturing the turning points in economic fluctuations. Because threshold levels may differ across states, we estimate a two-state threshold regression model as in
Koop and Potter (1999),
where the threshold variable is measured by the distance of the unemployment rate from its recent trough or from its recent peak if the peak occurs after a trough. This threshold generalizes the concept applied to the aggregate unemployment rate to not only economic peaks but also troughs. Each state’s threshold is then estimated from the data.
The blue line in the chart below shows the share of state unemployment rates which have crossed each state’s estimated threshold based on the current series of state unemployment data; the gold line shows the value for each month based on an out-of-sample exercise using real-time data and recursive estimation. The real-time series is only modestly noisier than the full sample and, thus, provides a similar signal. The share is very informative about onsets of recessions and, based on current data, is at low levels.
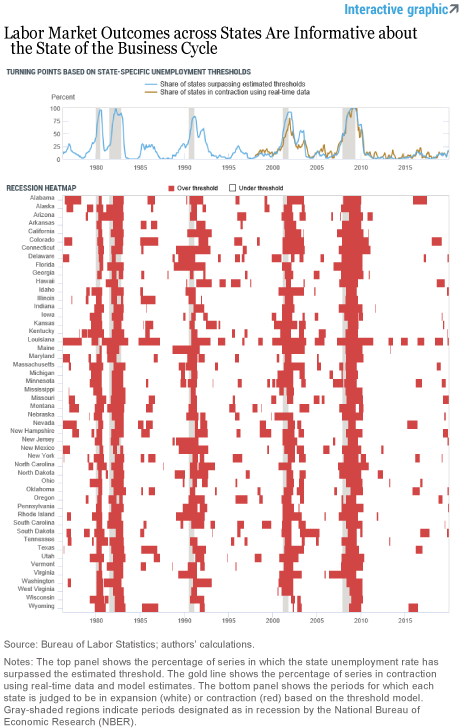
The heatmap in the bottom panel of the chart shows in rows each state unemployment rate with red pixels identifying months of the state unemployment above the threshold. Recessions are times of widespread increases in regional unemployment rates, which only a few states appear to be experiencing at the moment.

Richard Crump is a vice president in the Federal Reserve Bank of New York’s Research and Statistics Group.
Domenico Giannone was formerly an assistant vice president in the Bank’s Research and Statistics Group. This work was completed while he was an employee.

David Lucca is an assistant vice president in the Bank’s Research and Statistics Group.
DisclaimerThe views expressed in this post are those of the authors and do not necessarily reflect the position of the Federal Reserve Bank of New York or the Federal Reserve System. Any errors or omissions are the responsibility of the authors.
 RSS Feed
 Follow Liberty Street Economics
Good morning, very interesting case and conclusions. I just wonder if the threshold should not be adjusted by the level of unemployment (i.e., if a 50 bp threshold when unemployment rate is at 3.50% is the same when unemployment is at 10%). Thanks.