


The prices of U.S. imported goods, excluding fuel, have increased by 6 percent since the onset of the COVID-19 pandemic in February 2020. Around half of this increase is due to the substantial rise in the prices of imported industrial supplies, up nearly 30 percent. In this post, we consider the implications of the increase in import prices on U.S. industry inflation rates. In particular, we highlight how rising prices of imported intermediate inputs, like industrial supplies, can have amplified effects through the U.S. economy by increasing the production cost of goods that rely heavily on these inputs.
Breaking Down Import Prices by Industry
Import prices of industrial supplies and materials have been highly volatile in the recent period, as shown in the chart below, where we divide imported products by their end-use categories. The import price of industrial supplies (red) fell 4 percent with the COVID-19 shutdowns, and was 28 percent higher in July 2021 than its pre-COVID level.
The industrial supplies and materials category comprises intermediate inputs used along the supply chain: paper and paper base stocks; agricultural products and textile supplies; building materials; and unfinished metals, finished metals, and nonmetals for durable goods. The largest price increases within this category have been in unfinished metals for durable goods. Import prices of other end-use categories were far less volatile, with consumer goods prices just 1 percent higher.
How have these changes in import prices fed through the U.S. economy?
Imported Prices of Industrial Supplies Have Shot Up in Recent Months
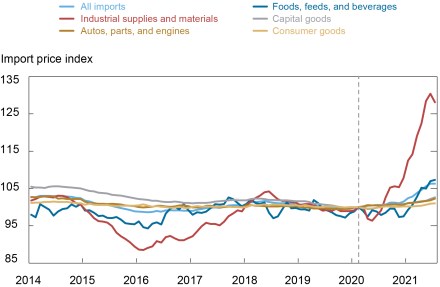
Source: Bureau of Labor Statistics (BLS).
Notes: We exclude fuel prices because they are generally highly volatile. The import price indexes are all indexed to 100 in February 2020 to coincide with the beginning of the COVID-19 pandemic. Each category’s share of total imports in 2017 was as follows: Foods, feeds, and beverages made up 6 percent; industrial supplies and materials 14 percent; capital goods 30 percent; autos, parts, and engines 17 percent; and consumer goods 28 percent.
Methodology
To understand how changes in import prices can affect U.S. domestic prices, we draw on a 2019 study that showed that changes in import prices can affect domestic prices through two channels: (i) strategic complementarities and (ii) marginal cost. The first channel captures how much domestic firms adjust their prices in response to changes in the prices charged by their foreign competitors. For example, if the price of imported cars increases, domestic car producers can also increase their prices. The marginal cost channel captures how much domestic prices change in response to changes in input costs, which are affected by imported intermediate inputs. For example, when the prices of imported steel go up, this affects the cost of producing cars, which feeds through to higher prices of domestically produced cars.
The 2019 study was able to isolate these two effects using a rich firm-level data set for Belgium. We apply that framework to the U.S. economy using industry-level data, since firm-level U.S. data are unavailable to us. Even though we will not be able to establish a causal relationship, we nevertheless uncover some interesting correlations.
We use industry-level producer price indexes (PPI) as our measure of industry inflation instead of the consumer price index (CPI) because a clear mapping between international products and domestic industry categories is only available for PPI categories. The PPI measures the price received by domestic producers for their goods or services, comprising both final goods and intermediate goods. It is constructed by the BLS from a monthly survey of establishments representing nearly the entire goods sector. Our analysis covers all tradable industries and is at the level of industry categories that are used to construct input-output tables by the Bureau of Economic Analysis, spanning 222 industries.
The Comovement of Import and Domestic Prices
To provide some context for the two channels outlined above, we first present two scatterplots of the change in producer prices against import prices and imported input prices, respectively. The panel on the left shows the 12-month change in import prices against the 12-month change in producer prices over the period July 2020 – July 2021 for all traded industries in our sample. This panel seeks to capture strategic complementarities by plotting, for each industry, the change in domestic producer prices against the change in import prices. The correlation between the two series was 57 percent over the recent period, more than double the correlation in the pre-COVID period (26 percent). This higher correlation likely reflects the fact that countries around the world have been hit with the same kind of supply-side shocks, driving all prices up. Several industries, particularly wood product manufacturing, iron and steel mills, and other categories of industrial supplies, stand out as having experienced particularly large increases in both producer prices and import prices.
U.S. PPI Increases with Import Prices: July 2020 to July 2021
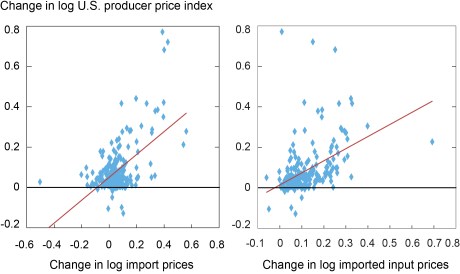
Source: Authors’ calculations.
Notes: The import price indices are constructed from highly disaggregated import prices (measured as the ratio of values to quantities) from U.S. Census measured as weighted averages using lagged annual import weights. The PPI data are from the BLS.
The panel on the right shows a similar scatterplot for the 12-month change in producer prices against the change in imported input prices for each industry. We construct this series from the import prices of all industries supplying a given industry, using the BEA’s input-output matrix. This panel seeks to capture the marginal cost channel. We find a strong positive correlation, 0.46, between an industry’s prices and the prices of its imported inputs over the July 2020 – July 2021 period, higher than the correlation of 0.31 in the pre-COVID period.
Channels through which Import Prices Affect U.S. PPI
We next analyze the effects of rising import prices on U.S. producer prices via the two channels described above using a more formal regression analysis. Since the correlation between import prices and domestic producer prices increased in the post-COVID period, we allow the pass-through to differ by running two separate regressions for the pre- and post-COVID periods. In the table below, we illustrate our results by considering how prices in the United States would be affected if import prices were to rise by 10 percent.
First, an increase in import prices allows domestic competitors to also increase their prices without losing market share—the strategic complementarities channel. In the first row, we see that a 10 percent increase in import prices is associated with a 0.3 percent increase in domestic producer prices due to this mechanism during the pre-COVID period, with this effect more than doubling to 0.67 percent post-COVID. The size of these effects depends on the share of consumption that imports account for, with the average imported share in the tradeable sector equal to 0.3.
Second, we see much larger effects through the marginal cost channel. When the cost of intermediate inputs rises, firms are likely to pass these on in terms of higher output prices, though some of the increase could be absorbed in profit margins. We estimate the effect of imported input prices on domestic producer prices in two steps. First, we examine the association between changes in the prices of imported inputs and changes in domestic input prices. We construct domestic input price indices using the producer prices of all industries that are inputs to a given industry according to the BEA’s input-output matrix, where the inputs include industrial supplies as well as other intermediate goods such as auto parts and semiconductors. In the second stage, we then relate the change in producer prices to the change in domestic input prices that is due to imported inputs. By using domestic input prices in the second stage of the estimation, our approach has the advantage of providing us with a broader measure of marginal costs. It also helps attenuate the omitted variable bias that could be caused by only including imported prices. Since our marginal cost measure does not include labor costs, our analysis omits any effect of import prices on producer prices operating through changes in labor costs.
As shown in the second row of the table, we estimate that a 10 percent rise in imported input prices is associated with a 0.7 percent increase in PPI pre-COVID and a 1.9 percent increase post-COVID.
Pass-Through from Import Prices to Domestic PPI more than Doubled during COVID Period
| Effect of a 10 percent change in import prices on PPI | ||
|---|---|---|
| Pre-COVID | Post-COVID | |
| 1. Strategic complementarities channel | 0.32 | 0.67 |
| (average share of imports=0.30) | ||
| 2. Marginal cost channel | 0.71 | 1.89 |
| (average share of imported inputs=0.18) | ||
| Total Effect (row 1 + row 2) | 1.03 | 2.56 |
Source: Authors’ calculations.
Notes: The pre-COVID period runs from January 2013 to February 2020, and the post-COVID period is March 2020 to July 2021.
Summing up the two effects, our regression analysis suggests that a 10 percent increase in import prices is associated with a 2.6 percent increase in PPI post-COVID, compared to only a 1.0 percent increase pre-COVID. Most of this effect (around 70 percent) flows through the marginal cost channel. The finding that the marginal cost channel dominates the strategic complementarities channel is consistent with other studies. However, the magnitude of both effects during the COVID period is much higher than in previous periods. This likely reflects that price increases around the world are being driven by common factors such as supply chain bottlenecks and pent-up demand. Studies that used variation in U.S. import tariffs to estimate the effects on PPI, which plausibly provide more exogenous variation for identification, found the same pass-through rate from tariffs to PPI as our pre-COVID results.
How Much Did PPI Increase due to Higher Import Prices?
Using our estimates, we show how much the actual changes in import prices contributed to changes in PPI via each of the two channels in the chart below. Each bar represents the twelve-month change in the PPI at the month indicated on the x-axis. The blue coloring indicates the change in the PPI that we attribute to the strategic complementarities channel based on our analysis, and the gold area shows the change due to the marginal cost channel.
The chart highlights three points. First, the contribution from the marginal cost channel is higher than the contribution of the strategic complementarities channel throughout the sample period, with the effect of marginal costs particularly high in the recent period. Second, the percentage point contribution to PPI has been the highest in the last three months compared to any month since the beginning of the sample. This larger contribution of import prices to the PPI is largely due to the bigger changes in imported industrial supply prices (as shown in the first chart), combined with the higher pass-through from import prices into the PPI (shown in the table). Third, PPI increases are significantly higher in recent months, consistent with the high headline inflation during that period, and the unexplained part (gray bars) is much larger than in any other period, highlighting that there are also other important, and atypical, forces hitting the economy during the pandemic.
In sum, we find that imported input prices have had an amplified effect on U.S. domestic prices in recent months, both because of their substantial rise and because of a higher pass-through rate.
Higher Import Prices Have Had an Amplified Effect on U.S. PPI in Recent Months
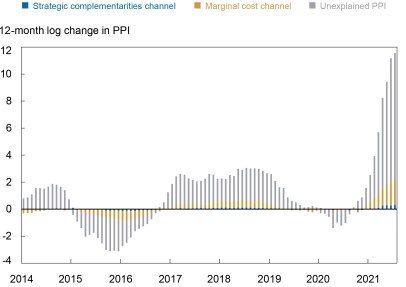
Source: Authors’ calculations using U.S. Census data.
Notes: The height of the bars reflects the log change in U.S. PPI. The blue bars indicate the percentage point contribution to PPI from the strategic complementarities channel; the gold bars indicate the percentage point contribution to PPI from the marginal cost channel.

Mary Amiti is a vice president in the Federal Reserve Bank of New York’s Research and Statistics Group.

Sebastian Heise is an economist in the Bank’s Research and Statistics Group.

Aidan Wang is a senior research analyst in the Bank’s Research and Statistics Group.
How to cite this post:
Mary Amiti, Sebastian Heise, and Aidan Wang, “High Import Prices along the Global Supply Chain Feed Through to U.S. Domestic Prices,” Federal Reserve Bank of New York Liberty Street Economics, November 8, 2021, https://libertystreeteconomics.newyorkfed.org/2021/11/high-import-prices-along-the-global-supply-chain-feed-through-to-us-domestic-prices.
Disclaimer
The views expressed in this post are those of the authors and do not necessarily reflect the position of the Federal Reserve Bank of New York or the Federal Reserve System. Any errors or omissions are the responsibility of the authors.
 RSS Feed
 Follow Liberty Street Economics