


Despite China’s tighter financial policies and the Evergrande troubles, Chinese financial stress measures have been remarkably stable around average levels. Chinese financial conditions, though, are affected by global markets, making it likely that low foreign financial stress conditions are blurring the state of Chinese financial markets. In this post, we parse out the domestic component of a Chinese financial stress measure to evaluate the downside risk to future economic activity.
Global Financial Stress Indicators
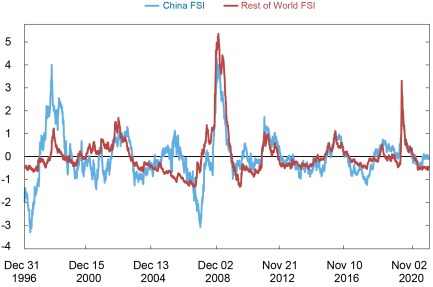
Groen, Nattinger, and Noble (2020) built summary measures of financial market stress for forty-six countries and regions across the world, with these summary measures incorporating data on equity prices, government bond yields, sovereign bond spreads, interbank spreads, and either local-currency corporate bond spreads (at different maturities) or U.S. dollar-denominated corporate bond spreads, depending on the country. The chart below depicts at a daily frequency the resulting financial stress index (FSI) for China and for a GDP-weighted average of all other countries, where the index levels reflect how many standard deviations financial market stress is above (+) or below (-) their average level over the sample (0). The chart shows a substantial degree of comovement across the stress measures, particularly during periods of large disruptions such as the Lehman Brothers collapse or the March 2020 pandemic shock, although there are also periods of distinct differences. More recently, the Chinese indicator has been at about average levels whereas the corresponding measure for the rest of the world has stabilized at below-average levels, suggesting that the rest of the world is experiencing relatively buoyant financial conditions.
China FSI Is Higher Relative to the Rest of the World in Recent Months
Sources: Authors’ calculations; Haver Analytics; Thomson Reuters; Bloomberg L.P.; Intercontinental Exchange Inc.
Notes: FSI is financial stress index. Rest of world FSI is constructed by aggregating the FSIs for AUS, ARG, AUT, BEL, BRA, BGR, CAN, CHL, COL, CZE, DNK, FIN, FRA, DEU, GRC, HUN, IND, IDN, IRL, ISR, ITA, JPN, KOR, MYS, MEX, NLD, NZL, NOR, PER, PHL, POL, PRT, RUS, ZAF, ESP, SGP, SWE, CHE, THA, TUR, TWN, GBR, USA, and VNM via GDP weights.
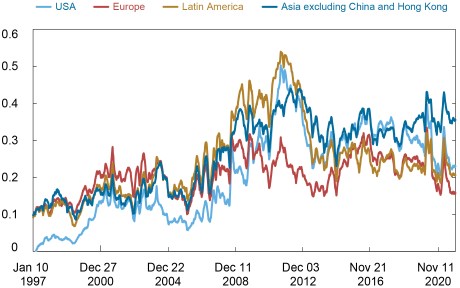
To distinguish between the domestic- and foreign-driven moves in our Chinese financial stress index, we look at the interrelationship between the Chinese financial stress index and the indices of the United States, Europe, and Latin America, as well as one for Asia excluding China and Hong Kong. (Technically, we estimate a time-varying parameter vector autoregressive model with the same structure as in Chan and Eisenstat [2018], in which each of the five stress indices depends on lags of all five indices, is hit by structural shocks with time-varying volatility, and experiences the time-varying impact of the structural shocks from the other four indices according to a certain ordering. In the model, we apply the ordering U.S., Europe, Latin America, Asia, and China, and each index affects all the indices ordered afterwards on the same day but responds to those indices itself the next day.)
The different parts of this model can be combined to produce daily correlations across the changes in the financial stress indices. The chart below shows these correlations for the Chinese indicator. In the early sample period, Chinese financial market stresses do not move closely with foreign financial market stress measures. This changes in the mid-2000s, and since then Chinese financial conditions have comoved more with changing foreign developments, in varying degrees, especially with the rest of Asia. The increased correlation of Chinese financial conditions with developments abroad might mean that not all moves in these conditions are of equal relevance for assessing the risks stemming from higher financial market stresses in China.
Comovement between China FSI and the Rest of the World Has Increased since the Mid-2000s
Sources: Authors’ calculations; Haver Analytics; Thomson Reuters; Bloomberg L.P.; Intercontinental Exchange Inc.
Notes: FSI is financial stress index. Aggregates are constructed via GDP weights.
Recent Developments
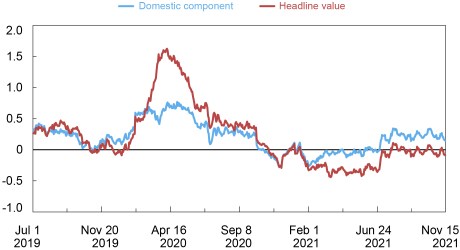
The framework can be used to parse out what part of the movement of the Chinese stress index has been domestically driven, by removing that part that is affected by unpredictable changes in foreign financial stress measures on the same day. The chart below plots the resulting domestic component of the Chinese financial stress index movements jointly with the original financial stress index since the second half of 2019. Because the Chinese COVID-19 lockdowns preceded those in the rest of the world, we see in the chart a rapid increase in domestically driven financial stress in China right after the start of 2020, with the domestic component largely driving the movement in the headline stress index. This is followed by a sharp hike in the headline Chinese financial stress index during the global financial markets’ meltdown in March 2020. During this episode the domestic component remains broadly stable, suggesting that all the headline moves were due to spillovers from increased financial market stresses abroad. After March 2020, both the headline Chinese financial stress index and its estimated domestic component trend down in conjunction toward below-average stress levels, until 2021. Since the end of 2020, the foreign moves continue to push the China stress index to below-average levels and then remain there up to the end of the summer after which it stabilizes at historically average levels. The index’s domestic component, however, starts to drift into above-average stress level territory up until late October, after which it stabilizes in still above-average territory. Especially after the intensifying troubles surrounding Evergrande in July, the domestic FSI component rose significantly further up to October 15, bringing it back to levels not seen since mid-2020.
The Domestic Component of the China FSI Has Put Positive Pressure on the Headline Value in Recent Months
Sources: Authors’ calculations; Haver Analytics; Thomson Reuters; Bloomberg L.P.; Intercontinental Exchange Inc.
Note: FSI is financial stress index.
What do the differences between the domestic and overall measures tell us about China’s economic prospects? One way to quantify the difference is to calculate the “growth-at-risk” levels for the respective indicators. Following the work of Adrian, Boyarchenko, and Giannone (2019), we fit quantile regressions using either changes in the headline financial stress index or in its domestic component. We can estimate the forecasted distribution of future growth where the growth rate at the fifth percentile represents a measure of the economy’s downside risk. Note that we use monthly GDP numbers that are interpolated from quarterly GDP by using data on industrial production, retail sales, exports, and imports, as outlined in Groen, Nattinger, and Noble (2020).
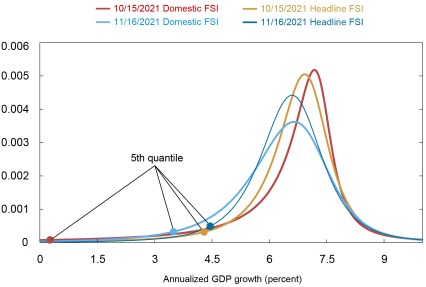
As can be seen from the chart above, the domestic component peaked on October 15 and then stabilized. The chart below plots the forecasted distributions for one-year-ahead Chinese GDP growth based on the one-year change in the domestic component of the Chinese financial stress index on October 15 (red line) as well as November 16 (light blue line), which represents the end of our sample. Also included in this chart are the forecasted distribution from the one-year change in the headline financial stress index on October 15 (gold line) and November 16 (dark blue line). The chart makes clear that at the index’s recent peak on October 15 the increases in domestically driven financial market stress signaled significantly larger downside risks to the Chinese growth outlook than if one looked solely at the overall indicator of financial market stress that includes the impact from foreign spillovers. Specifically, the change in the overall stress index puts the adverse 5 percent slice of the distribution at 4.3 percent growth from October 2021 to October 2022. Using just the domestic component on October 15 puts it at 0.3 percent. Since then, the adverse impact of heightened domestic financial stresses seems to have tempered, although the downside risks to future growth remain elevated compared to those based on the headline stress index.
At-Risk Growth Has Tempered over the Past Month
Sources: Authors’ calculations; Haver Analytics; Thomson Reuters; Bloomberg L.P.; Intercontinental Exchange Inc.
Notes: FSI is financial stress index. The forecasted distributions pertain to growth between October 2021 and October 2022 and growth between November 2021 and November 2022.
Conclusion
Globally, financial market stresses have eased significantly since the spring of 2020. Although Chinese financial conditions are at historically average levels, they have trailed the rest of the world. Given the relatively large degree of comovement in financial conditions across countries, this suggests that a potentially significant buildup in Chinese domestic financial market stresses has been masked by conditions abroad. The domestic component from our index of financial market stress in China indeed reveals that domestically driven financial market stresses have moved higher since the start of 2021. Although its peak in October was below the levels seen in early 2020, the still-high stress level signaled a substantial downside risk to the Chinese growth outlook.

Jan Groen is an officer in the Federal Reserve Bank of New York’s Research and Statistics Group.

Adam Noble is a senior research analyst in the Bank’s Research and Statistics Group.
Disclaimer
The views expressed in this post are those of the authors and do not necessarily reflect the position of the Federal Reserve Bank of New York or the Federal Reserve System. Any errors or omissions are the responsibility of the authors.
 RSS Feed
 Follow Liberty Street Economics
Jan Groen and Adam Noble,
Well done, on your attempts to parse both the Domestic and International data and create a blended future projection.
Assessing internal data can be challenging due to the noise often created Politically via the Local, State. and National Government Agendas.
In Addition, aggregate inflows and outflows of goods and services appear deeply stressed versus 2019 and may prove lagging due to continuing political and pandemic constraints.
Finally, The outflow of Major International Corporations that have announced the transferring of production facilities out of China and into other neigboring Indo-Chinese Countries are beginning to have both near-term and long-term negative economic implications on the National Economy.
Appreciate your work, -Best Jim-
Correction to my post the word Stree should read Stress.
The sinking Chinese Real Estate/Developers MKTS and Significant Debt Issues will dictate/reveal the Chinese Stress. It is going to get worse and Stree will rise.