


Editors’ note: The second chart in this post has been updated to correct for a slight undercount of the adult population in some deciles. The adjustments were minor and do not affect the substantive conclusions of this analysis. (5:30 p.m. ET, Sept. 29)

On August 24, 2022, the White House released a plan to cancel federal student loans for most borrowers. In April, we wrote about the costs and who most benefits from a few hypothetical loan forgiveness proposals using our Consumer Credit Panel, based on Equifax credit report data. In this post, we update our framework to consider the White House plan now that parameters are known, with estimates for the total amount of forgiven loans and the distribution of who holds federal student loans before and after the proposed debt jubilee.
We estimate that the plan will cancel roughly $441 billion in federal student loans which would eliminate federally-held balances for 40.5 percent of federal borrowers, forgiving 31.1 percent of the total outstanding federal student loan balance. In our estimation, 5.1 percent of borrowers will be ineligible for forgiveness due to the income threshold. Distributionally, we find that the plan, particularly because of the additional forgiveness for Pell grant recipients, pushes more forgiveness dollars toward borrowers living in lower- and middle-income neighborhoods than borrowers living in higher-income communities. By our count, 65 percent of federal student loans are held by borrowers living in neighborhoods with median household income below $83,000, and borrowers in these neighborhoods receive 72 percent of proposed loan forgiveness. Student loan borrowers residing in lower- and middle-income neighborhoods are more likely to have delinquent or defaulted balances and are more likely to have their loans completely forgiven by the plan. Overall, we find that the White House plan directs modestly higher average forgiveness amounts to lower- and middle-income areas. Because these borrowers have higher delinquency rates and balances that are larger relative to their incomes, forgiveness will have a more substantial impact on lower-income student loan borrowers.
Data and Methods
For this analysis, we use data from the New York Fed Consumer Credit Panel, which is a 5 percent anonymized sample of credit reports from Equifax. We directly observe loan balances, delinquencies, risk scores, and the U.S. Census block group associated with a borrower’s address. We limit the sample of student loans to only those owned by the federal government in the second quarter of 2022. This exclusion results in a total of 38 million borrowers with outstanding student debt totaling $1.418 trillion. This aligns closely with publicly available data on holdings by the U.S. Department of Education which report a total of $1.476 trillion combined across Direct loans, Family Federal Education Loan (FFEL) balances owned by the federal government, and defaulted FFEL balances which are all eligible for forgiveness. We attribute the $58 billion shortfall in our estimate of total outstanding loans to balances that were defaulted more than seven years ago and thus no longer appear on credit reports.
The White House plan calls for cancelling loans for borrowers earning less than $125,000 (individuals) or $250,000 (households). Borrowers who received a Pell grant while in college would receive up to $20,000 in cancellation, while those who never received a Pell grant would receive up to $10,000. We estimate the probability of Pell grant receipt for each borrower by combining information about the household income distribution of each borrower’s neighborhood when they first borrowed federal student loans with data from the National Center for Education Statistics on Pell grant receipt by income and dependency status. Our algorithm produces a Pell grant rate among federal borrowers of 59.6 percent which is on par with the estimate from the administration of 60 percent. We estimate the probability that each borrower is under the income threshold using the household income distribution from the American Community Survey and the national income distribution of student loan borrowers by age and credit score from the New York Fed’s SCE Credit Access Survey. More details, including a discussion of the advantages of our data and methods, can be found in our Technical Appendix.
How Much Debt Is Forgiven?
As noted above, we estimate that the White House plan would cancel $441 billion in outstanding loans, accounting for 31.1 percent of the student loan portfolio owned by the federal government. This plan would also cancel 42 percent of student debts that were in default or severely delinquent prior to the pandemic. Our analysis indicates that 40.5 percent of borrowers with loans owned by the federal government would have their outstanding federal balance completely forgiven. In addition, we estimate that 5.1 percent of borrowers will be ineligible for loan cancellation due to the income restrictions.
Who Benefits?
As in our prior post, we consider the effects of the cancellation plan through the lens of income level and geography. First, we examine the distribution of beneficiaries by deciles of median neighborhood income. In aggregate, between $40 billion and $47 billion in debt would be cancelled for each income decile, and the amounts are relatively stable up to the highest-income decile, which sees a decline due to the income criteria. In the chart below, we plot the average federal student loan balance held in each decile alongside the average amount of forgiveness. Although the average forgiveness amount per eligible borrower is relatively stable across income (but declining throughout), lower-income borrowers tend to have smaller balances, so the forgiveness amount is a much larger share of their balances. The average forgiveness amount makes up nearly two-thirds of the average balance in the lowest income areas, where borrowers are also likelier to be receiving Pell grants. But the highest income areas will see a more modest reduction of their balances. Average balances in the wealthiest areas topped $35,000 before the forgiveness event and these borrowers were less likely to receive a Pell grant. Considering the extremely high debt-to-income ratios of borrowers in the lower-income deciles, the cancellation of balances will significantly improve these borrowers’ financial positions. For example, borrowers in the second income decile had student loan balances more than 50 percent of their annual income before forgiveness, but post-forgiveness will see more than a 20-percentage-point reduction in their implied debt-to-income ratios.
Borrowers in lower-income neighborhoods would receive the largest reductions in balances
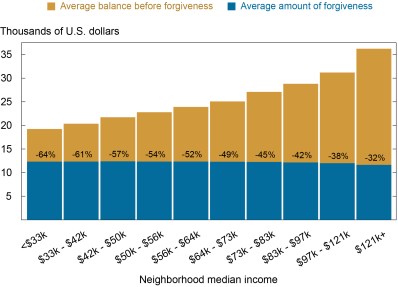
Note: The percentage figures depicted within the bars denote the percent reduction in average balances for each decile relative to the average forgiveness amount for each decile.
In the next chart, we show that the prevalence of federal student loans is relatively constant across the bottom nine deciles with each decile having between 11 percent to 13 percent of the adult population owing federal student loans. This share drops to 10.3 percent for the highest income neighborhoods. After the proposed cancellation, the share with federal loans is cut roughly in half for the lowest-income neighborhoods, largely because borrowers in these neighborhoods have smaller balances and a greater probability of having received a Pell grant.
Student loan prevalence in the lowest-income areas will be nearly halved after forgiveness
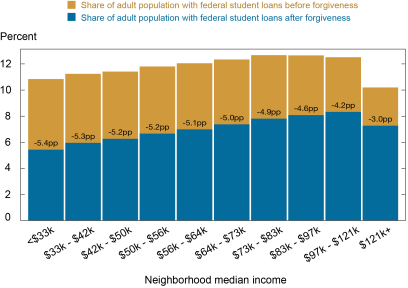
Notes: Under the forgiveness plan, some borrowers will see their debts completely cancelled. The percentage point figures within the bars denote the percentage point decline in the shares of the adult population holding federal student loans as a result of the forgiveness event.
Next, we examine how loan cancellation affects the stock of delinquent and defaulted federal student loans. Since the administrative forbearance on federal student loans, which began in 2020 and has been extended since, marked all delinquent loans as current, we hold fixed the loan status for each loan at its value in February 2020 but use reported balances as of the second quarter of 2022. As we note in the introduction, approximately 42 percent of balances that were delinquent or in default prior to the pandemic will be forgiven. But these forgiven delinquent balances are not evenly distributed—lower-income areas previously held higher shares of delinquent debt and will see a substantial reduction in the balances that were delinquent or in default. This total amount and the share are declining across the income deciles.
Previously delinquent and defaulted debt is reduced by more than 40 percent in lower- and middle-income communities
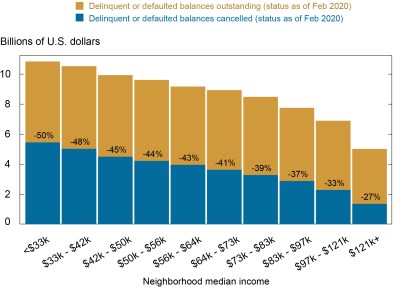
Note: The percentage figures depicted within the bars denote the percent reduction in (pre-pandemic) delinquent or defaulted debt for each income decile due to loan forgiveness.
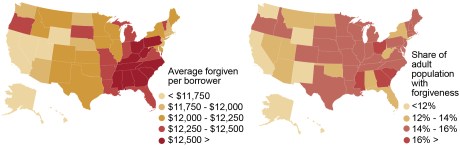
Lastly, we present statistics for federal student loan cancellation by borrower’s state of residence. On the left of the panel chart below, we present the average amount of debt forgiven per eligible borrower by state. The seven with the highest average amounts are in the Southern Census region: Washington, D.C. (largest), North Carolina, Georgia, South Carolina, Alabama, Mississippi, and West Virginia. The six states with the lowest average forgiveness amount per eligible borrower are all in the West: Utah (smallest), Wyoming, Hawaii, Alaska, Nevada, and California. In the right chart panel, we present the share of the adult population receiving any forgiveness. Again, many Southern states lead in this metric with Ohio joining Georgia, Washington, D.C., South Carolina, and Mississippi as the areas with the largest share benefitting, and Western states have the smallest share of the adult population receiving any loan cancellation.
Income limits and regional income disparities send more average benefit to Southern states
State of Student Loans after Forgiveness
This debt jubilee event, if it comes to pass, will be the most significant policy in the financing of higher education since the introduction of modern Pell grants fifty years ago. While the premise of a large-scale debt forgiveness has existed since ancient times, there are few recent equivalents to use as a historic baseline to understand future impact, particularly since student loans are difficult to discharge in bankruptcy. The only other (albeit smaller-scale) debt cancellation event studied recently resulted in a large reduction in defaults for other debts, higher geographic and labor mobility, and higher earnings for borrowers whose debts were cancelled. Without prior large-scale experiences to look to, the fact remains that student loan borrowers have experienced more credit distress than non-borrowers. Troubled student loan borrowers have lower credit scores, and often struggle with repaying their credit card and auto loan debts, and are less likely to own homes. The reduction in student debt prevalence and balances will create a substantial financial improvement for borrowers, particularly among those with lower incomes. As details of the plan continue to emerge, we will monitor the borrowing appetite of the forgiven borrowers, as well as the credit performance on their other debts, to study the extent of the effect of the broad loan cancellation.
Data for Charts and State Maps

Jacob Goss is a senior research analyst in the Federal Reserve Bank of New York’s Research and Statistics Group.

Daniel Mangrum is a research economist in Equitable Growth Studies in the Federal Reserve Bank of New York’s Research and Statistics Group.

Joelle Scally is a senior data strategist in the Federal Reserve Bank of New York’s Research and Statistics Group.
How to cite this post:
Jacob Goss, Daniel Mangrum, and Joelle Scally, “Revisiting Federal Student Loan Forgiveness: An Update Based on the White House Plan,” Federal Reserve Bank of New York Liberty Street Economics, September 27, 2022, https://libertystreeteconomics.newyorkfed.org/2022/09/revisiting-federal-student-loan-forgiveness-an-update-based-on-the-white-house-plan/.
Disclaimer
The views expressed in this post are those of the author(s) and do not necessarily reflect the position of the Federal Reserve Bank of New York or the Federal Reserve System. Any errors or omissions are the responsibility of the author(s).
Disclaimer
An author of this post holds federal student loans.
 RSS Feed
 Follow Liberty Street Economics
When the application will be available, this is going to be a great help for the communities. We appreciate the opportunity thanks in advance my president 🙏 great job 👍
Can we forgive loan for those people who has been paying in time theb got laid off?