Les Miserables, by Victor Hugo, is one of the most endearing and best-known novels of all time. Judged a literary masterpiece by many, when it was first published in 1862 by one of France’s greatest literary heroes, the work was met with hostility for political and aesthetic reasons. Yet, the story has been popular, published many times over, translated into several languages, and adapted in recent years to its perhaps most widely familiar forms on the musical stage and cinematic screen.
At Northwestern, the novel is a frequent centerpiece of courses offered by Professor Michal Peled Ginsburg, of the Department of French and Italian. From Spring of 2014, with assistance from both the MMLC and from NUIT, she has worked to boost students’ and scholars’ understanding the novel via two key visualization techniques: first, a series of updated maps to indicate landmarks, event locations and paths traveled, and secondly, a series of insightful computer-generated illustrations of the book’s characters and their relationships to one another.
In January of this year, Michal demonstrated some of the visualizations and discussed some of the thinking around them at an MMLC World.Wine.Web. event. In this article we will explore further the story of how the MMLC has contributed to these ongoing visualization efforts.
Mapping the Places and Characters
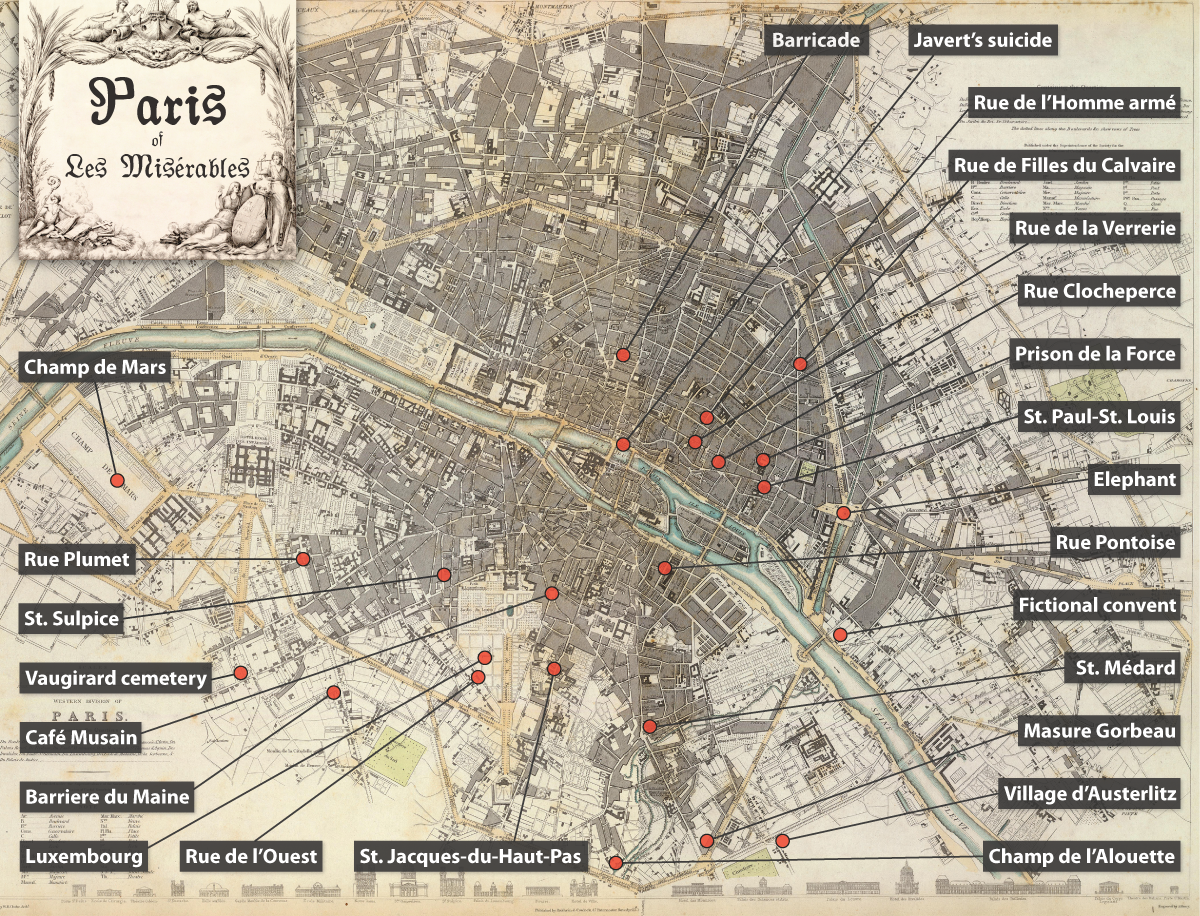
Map of many of Landmarks found in Les Miserables generated early-on in the project by the MMLC using Google map landmark data compiled in assistance with NUIT.
One of the most classic ways of visualizing narratives, particularly those whose plots take place in real cities and places, is to locate important the sites of important events on illustrative maps. While Paris, the setting for part of Les Miserables, is a timeless city, things have nonetheless changed since the time of Hugo’s novel: many streets, bridges, quays, and alleys have been renamed. Moreover, like many works of fiction, the novel is not always specific about names, using terms like “les rues basses” which the reader is supposed to interpret as some set of insignificant, lower roads nearby.
In her initial work with NUIT, Michal meticulously located some of the novel’s main sites using a Google Earth map that allowed superimposing the same location markers on top of period maps from the Rumsey collection. This proved immediately useful for visualizing the geography of the novel. Once major locations were identified, students could see how one entire quadrant of Paris was of little or no interest to the novel. Despite its technological sophistication the dynamic form of the map presented two unexpected practical challenges: the Google earth view did not simultaneously show a well-designed macroscopic (zoomed-out) view with readable labels, and because the map was digital, it did not print out well in black-and-white, a logistical requirement for being able to easily reuse and reproduce the maps.
Picking up from the work of NUIT, the MMLC’s Sergei Kalugin began by creating a static version of the map that would address the specific needs: compatibility with PowerPoint as a single slide, and a design and base-map suitable for printing. From there, work has continued on additional maps to chart the itineraries of characters and their movements through the city.
Understanding and Visualizing Character Networks
In addition to geography, there was another way that Michal wished to “map” the novel: by visualizing the novel’s characters collectively, identifying their relationship to one another and the groups they might be said to form – essentially, the social networks of the novel.
Those who think of social networks first in terms of media like Facebook or Twitter probably understand that we share a lot about ourselves and our relationships — perhaps unwittingly too much — in very public and easily accessible ways online. Some of us probably even know that companies and (and government intelligence agencies) work very hard to harvest that data and to better understand social networks to drive appropriate campaigns. It should be no surprise that data science and data visualization are popular areas of study today. Depaul University’s data science programs even recently ran a series of beautiful advertisements on various busses and trains in the Chicago area.
Though much attention has been drawn to data science, it builds on a long history of mathematical and computer science topics including graph theory and combinatorial optimization. Legendary Stanford University professor and computer scientist Donald Knuth made a major impact on the field with his 1990 publication of The Stanford GraphBase: A Platform for Combinatorial Computing. In addition to well-documented graphing algorithms — the processes and procedures that make up larger programs — the book included a very useful companion of data files that represented inspirational data networks. Among these files were lists of characters and their chapter-by-chapter meetings in a handful of well known literary works that Knuth had read and encoded into data sets. These included Huckleberry Finn, The Iliad, Anna Karenina, and Les Misérables.
As a result, the story and characters of Les Misérables are not only frequently studied by scholars and enthusiasts of French literature but also by computer scientists. From Knuth’s original data, the encounters of the many characters of Les Misérables often serve as a frequent references for comparing computational algorithms — specifically, algorithms that examine relationships among individuals and the way that they can be said to form communities.
In 2003, Cornell professor Michelle Girvan and University of Michigan professor Mark Newman proposed a novel way of detecting communities among arbitrary networks in a 16-page paper, “Finding and evaluating community structure in networks.” The 14th page of their paper included an eye-catching depiction of how their algorithm identifies communities Les Miserables using Knuth’s original data.
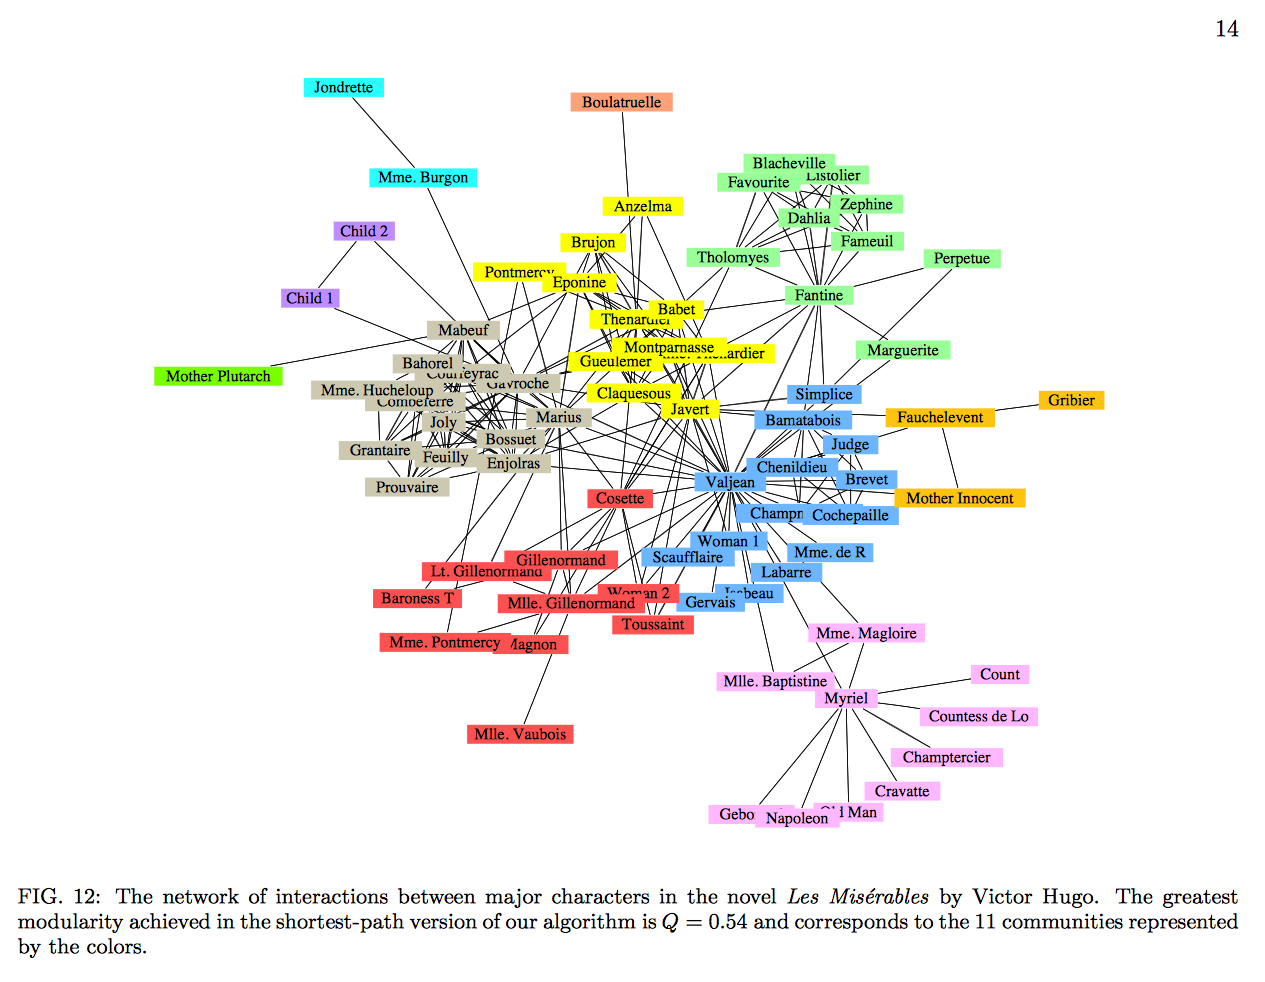
An example of how the network of characters was studied by Newman and Girvan, using Donald Knuth’s original (yet incomplete) dataset.
It was this graph that Michal accidentally discovered and gave her the idea of further studying character networks and researching ways of visualizing the characters and their communities. Initially, she found the above diagram promising for its ability to quickly show relationships. However, as an expert of the novel, she then quickly found that it contains some errors: for example, characters are missing or misreported. For example, “Jondrette” in the upper left should really be the same character as “Thénardier,” since it is an alias. The main errors, however, are of omission.
This led to a long period of exploration: If all the characters should be added to the data, what algorithm would group them best? What rules or heuristics do different algorithms use and how are these different from human thought? And, on a more practical level, with so many characters, could they all be fit into a graph that would be immediately legible?
Righting the Wrongs to Build a Better Diagram
In coding an original dataset for Les Miserables and other novels, Donald Knuth made a lasting contribution to the field of data science, but not without some errors and omissions. Even Knuth recognized and acknowledged some of these early on but ultimately decided not to correct the original data set, leaving it permanently intact as “more or less accurate.” After all, if a purpose of the data set was to compare one computer program to another, the data should to remain consistent.
To support scholarly study of the novel, correcting the data was one of the first priorities that Michal established.
Working with the original data files provided directly by Knuth, Michal pored over the novel carefully and doubled the number of characters included in the data file, using the rule that every character, even the most minor one, counts. With the first round of corrections, Michal began enlisted the help with Phil Burns from NUIT to develop models of presenting the data using online, sortable data tables and to transform the data into a preliminary force-directed network graph, using the open-source program, Gephi. Phil offered both of these to Michal to further improve.
It was at this point that the MMLC entered the collaborative process, taking the initial Gephi-based diagrams and data, further stylizing and tweaking them to make characters and their relative significance more visible.
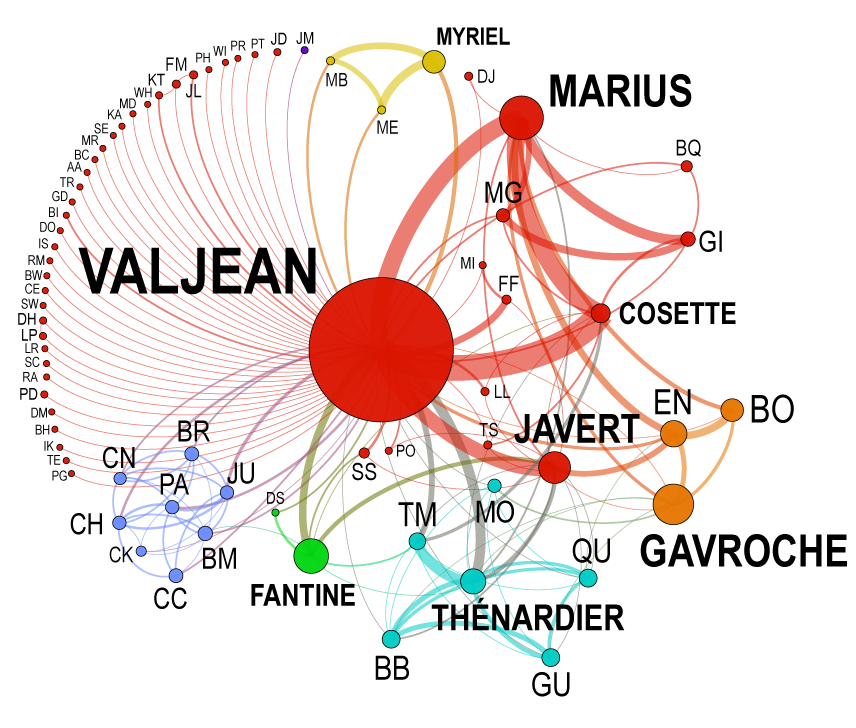
An early visualization produced by the MMLC focused on characters who encounter protagonist Jean Valjean. The thickness of the line indicates frequency of encounter. Many characters meet Valjean only once.
Over the course of the following months, the MMLC sporadically revisited the project to continue improving the visualizations, starting with a comparison of different algorithms for detecting communities. Using the powerful data analysis program GNU R, together with the igraph library, we compared the Louvain method (used here), the Spinglass method, Leading-Eigenvector, and Newman-Girvan method before deciding that while not perfect, the Newman-Girvan analysis produces the most satisfying result.
To give the character graph a temporal dimension, the project team produced a series of five graphs to represent each of the novel’s five parts independently. To help speed the translation of the updated data files into visualizations, the MMLC wrote a handful of small Java-based programs to convert the data files into lists of nodes (characters) and edges (connections).
As the project team nears the end of April, work on the various visualizations is nearly complete.

This more recent graph incorporates the full dataset of characters and applies the Newman-Girvan grouping algorithm.
Writing the Book (Literally) on Les Miserables
Having given considerable thought to how to make the novel more accessible to students, Michal is now also in the process of co-editing a volume entitled Approaches to Teaching Hugo’s Les Misérables, which will be published by the Modern Language Association as part of the “Approaches to Teaching” series. The volume includes essays by twenty-two scholars on different aspects of the novel and different approaches to teaching it. It will include maps of sites and itineraries, with a commentary by Michal on the representation of the city in the novel. Because interactive visuals cannot be as effectively presented in print form, the character graphs will be made available in an online companion to the volume
Furthermore, as part of a contribution to the greater community and to give scholars an updated starting point, the project team is making an effort to share several digital assets related to the recent investigations, including all of the updates to the Les Miserables data files and custom-written software tools, on a publicly-available GitHub repository.
The MMLC: Here to Help Faculty Better Understand, Manipulate, and Teach with Data
The MMLC considers data manipulation and visualization to be among a growing set of critical skills for humanistic inquiry. In winter quarter, the MMLC offered a well-received two–part workshop series on data and visualization. This series will be offered again in fall quarter of 2015. Faculty interested in learning more about how maps and network graphs can look forward to an opportunity to deepen their knowledge in the coming months.