GOOD FOR THE ECONOMY.
GOOD FOR THE ENVIRONMENT.

the Full
Report


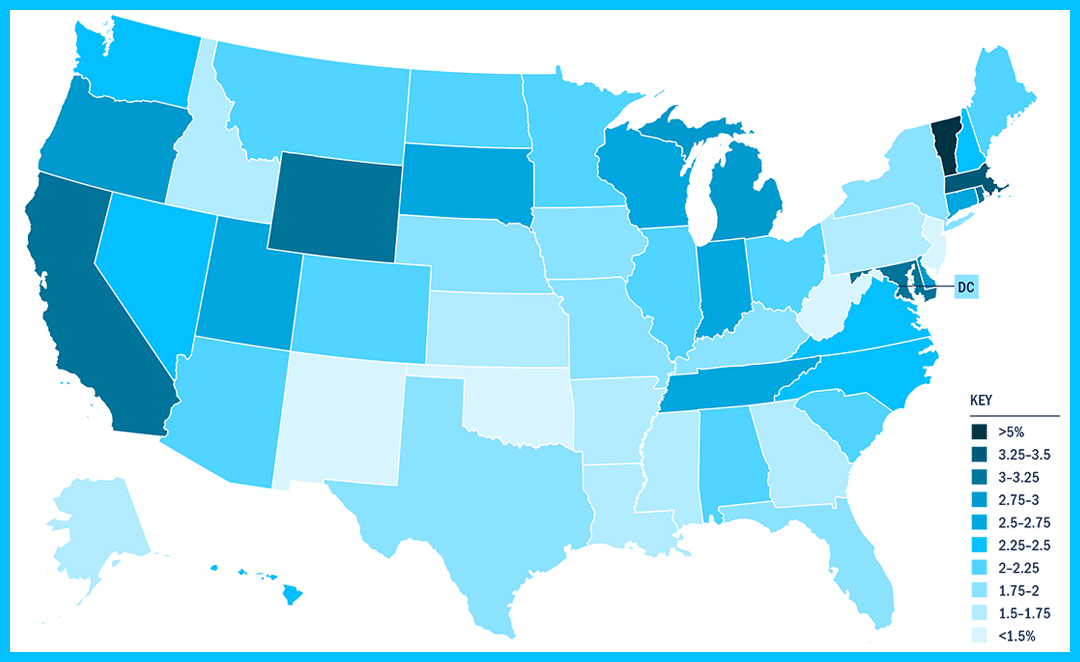
Clean energy is a critical job creator in every region, state, metro, and county
Employing 1 in every 50 American workers, more Americans today work in clean energy than as nurses, cashiers, elementary and middle school teachers, and waiters and waitresses.
Clean energy now accounts for more than 3 percent of all new jobs added every year in the U.S., creating more jobs across more occupations in more areas than just about any sector of the economy. Done right, clean energy can create new opportunities for all Americans – in red and blue districts, in cold and warm climates, rural and urban, coastal and heartland.
Over the past two years clean energy jobs have grown by more than 10 percent, faster than the overall energy industry and overall U.S. employment. It’s a trend that’s expected to continue as the sector begins to feel the full impact from historic investments passed in the Inflation Reduction Act (IRA). Clean energy and clean vehicle companies announced 210 major projects across 38 states in the year after the IRA was signed into law on August 16, 2022.
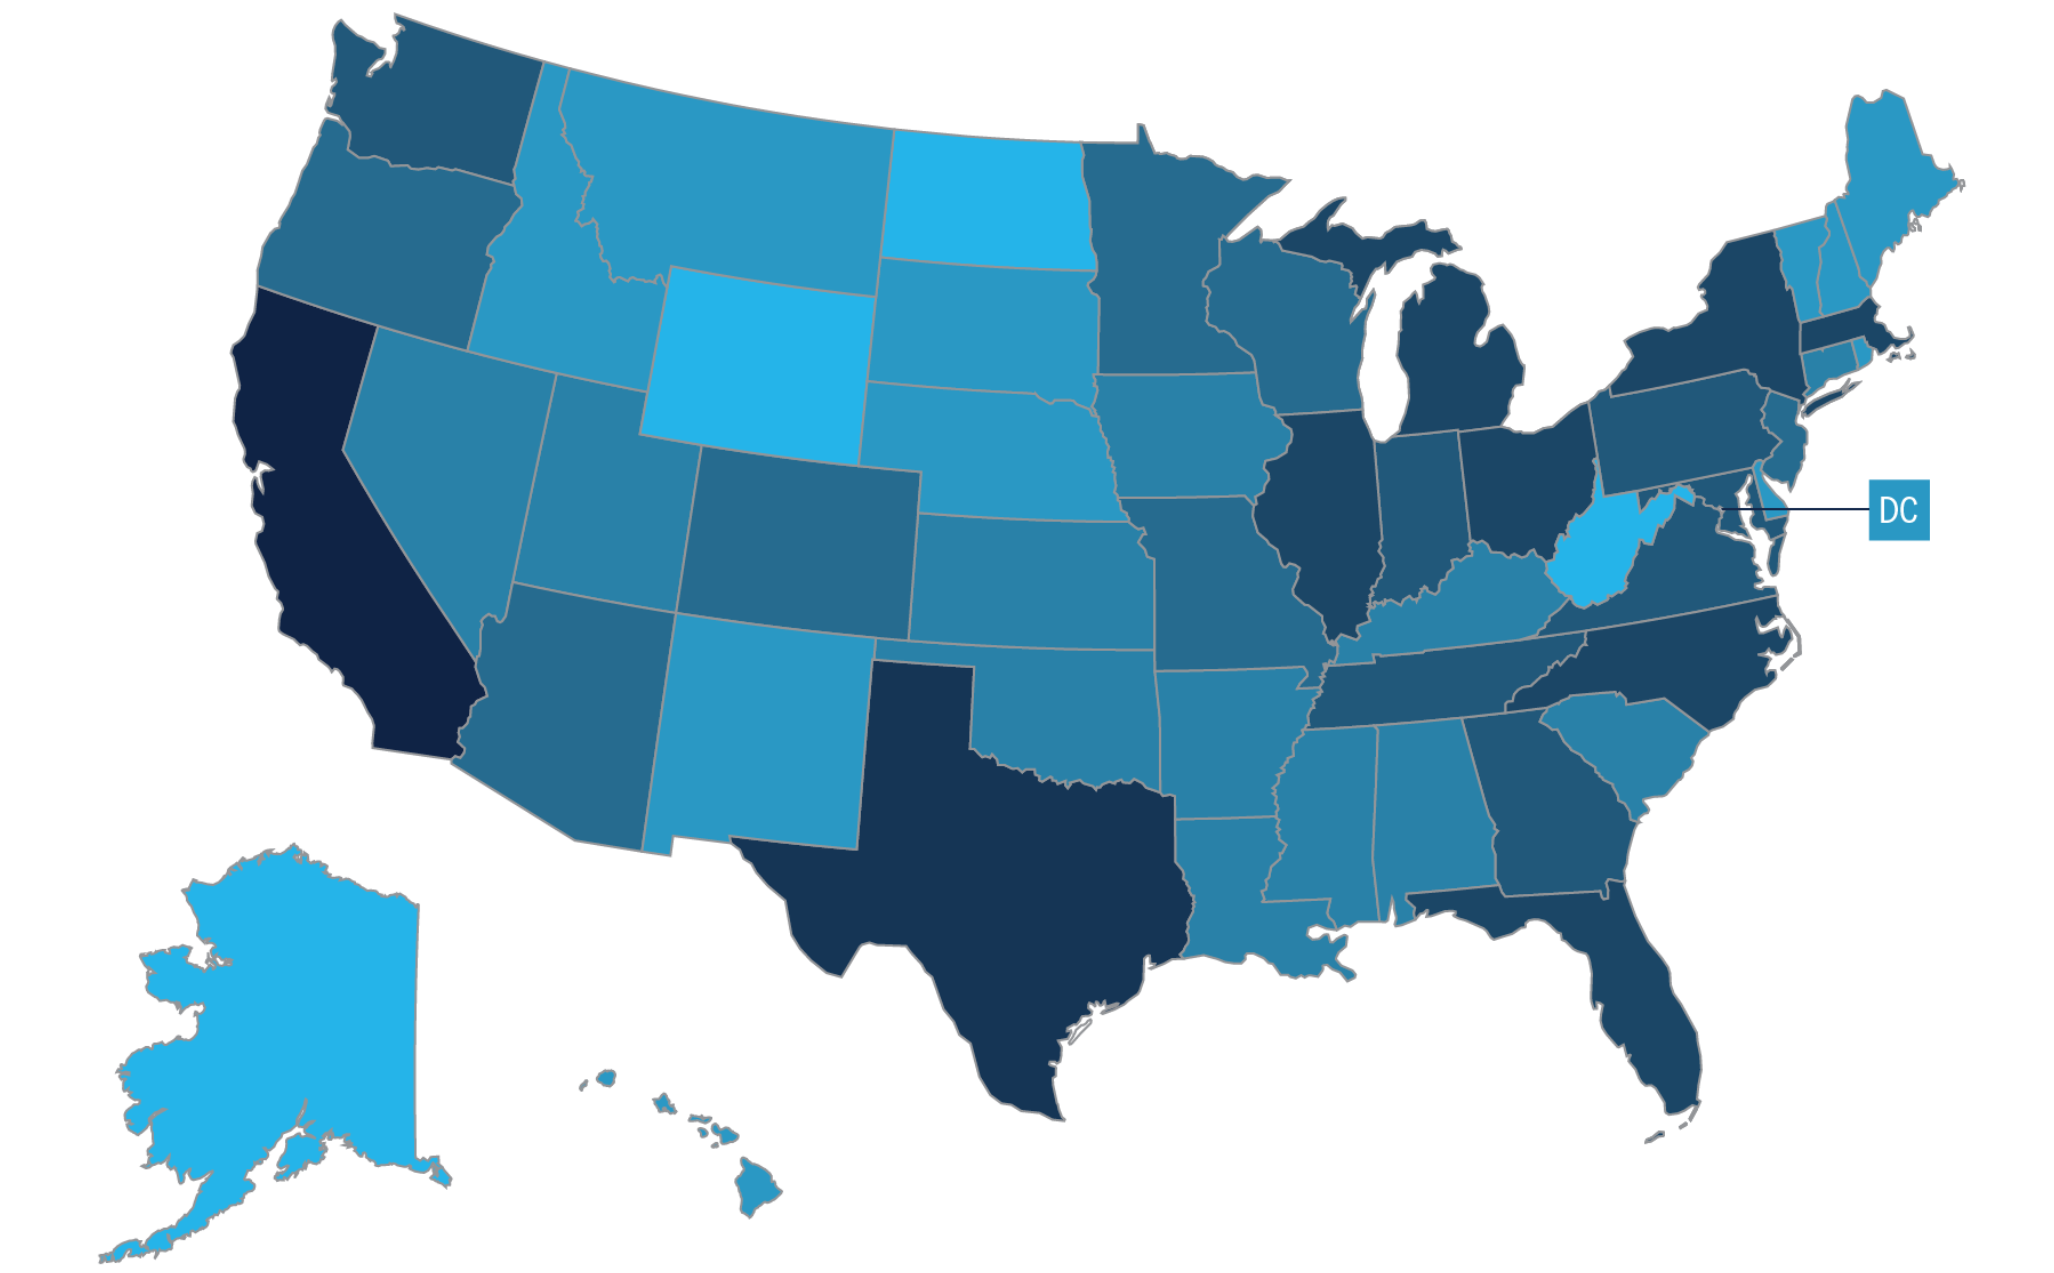
Most Clean Energy Jobs | STATES
California |
523,480 |
Texas |
251,774 |
New York |
166,014 |
Florida |
165,857 |
Michigan |
123,983 |
Illinois |
123,799 |
Massachusetts |
118,165 |
Ohio |
114,395 |
North Carolina |
105,370 |
Pennsylvania |
96,317 |
Most Clean Energy Jobs | COUNTIES
Los Angeles County (CA) |
97,849 |
Harris County (TX) |
60,987 |
Orange County (CA) |
56,562 |
Cook County (IL) |
54,181 |
San Diego County (CA) |
50,551 |
Most Clean Energy Jobs | METROS
New York |
157,562 |
Los Angeles |
154,411 |
San Francisco-Oakland |
103,216 |
Boston |
95,129 |
Chicago |
92,929 |

*Total clean energy jobs includes employment in energy efficiency, renewable energy, clean fuels, clean vehicles, and storage and grid modernization
DOWNLOAD: Clean Jobs America Data Tables Available Below

Clean Energy Jobs Breakdown
Clean Energy Jobs by Sectors
Energy Efficiency 2215432
Renewable Energy 534603
Clean Vehicles 373604
Grid and Storage 151412
Biofuels 40141
Energy Efficiency: 2,215,432 jobs
Renewable Generation: 534,603 jobs
Clean Vehicles: 373,604 jobs
Storage & Gird: 151,412 jobs
Biofuels: 40,141 jobs

Clean Energy Sectors by Job Growth
Energy Efficiency: +50,517 jobs
Renewable Generation: +19,355 jobs
Clean Vehicles: +47,760 jobs
Storage & Grid: +8,360 jobs
Biofuels: +1,052 jobs

Clean Energy Jobs by Value Chain
Construction 1599225 jobs
Manufacturing 492057 jobs
Professional Services 732587 jobs
Wholesale Trade 272821 jobs
Utilities 15123 jobs
Agriculture 34087 jobs
Other Services 169299 jobs
Construction: 48.2%
Manufacturing: 14.8%
Professional Services: 22.1%
Wholesale Trade: 8.2%
Utilities: 0.5%
Agriculture: 1.0%
Other Services: 5.1%

U.S. Job Growth by Percentage Increase 2020-2022
Clean Energy Employment
Total Energy Employment
U.S. Overall Employment
417883
Clean Energy Jobs in Rural Areas
2215
Counties Added Clean Energy Jobs in 2022
288
Metros Are Home to 1,000+ Clean Energy Jobs
30
States Have 30,000+ Clean Energy Workers
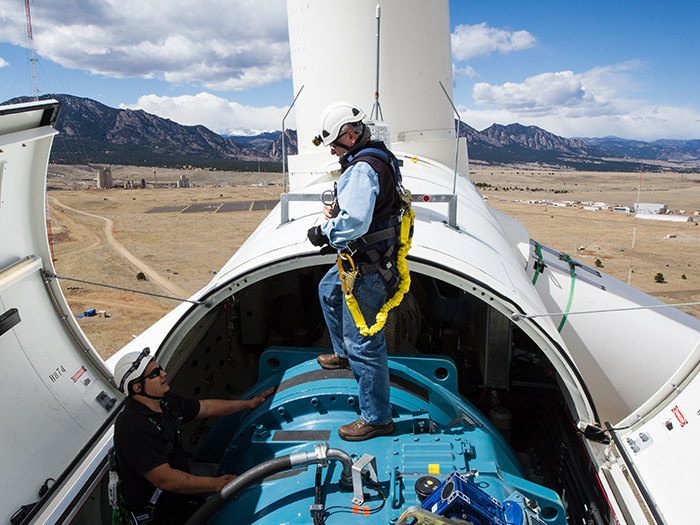
Credit: NREL/Dennis Schroeder
Go Deeper on Clean Energy Jobs
August 14, 2023
One year after the Inflation Reduction Act (IRA) was signed into law on August 16, 2022, private industry has announced at least 210 major new clean energy and clean vehicle projects across 38 states.
October 22, 2020
Clean energy jobs paid 25% more than the national median wage in 2019 and were more likely to include health care and retirement benefits.
September 9, 2021
Lack of diversity in clean energy technologies threatens to cause Women, Hispanic and Latino workers, and Black workers, in particular, to miss out on one of America’s great economic expansions.
October 19, 2022
33 percent of all billion dollar disaster costs since 1980 in the U.S have occurred in the last 5 years, totaling $765 billion in losses and more than 4,500 deaths from 2017 to 2021—were nearly eight times higher than in the 1980s.
Credit: NREL/McKinstry
About this Report
The analysis expands on employment data collected and analyzed by the BW Research Partnership for the 2023 U.S. Energy and Employment Report (USEER) released by the Department of Energy (DOE). The USEER analyzes data from the U.S. Bureau of Labor Statistics (BLS) Quarterly Census of Employment and Wages (QCEW) to track employment across many energy production, transmission, and distribution subsectors. For more information on the methodology click here.
This is the eighth annual Clean Jobs America report produced by E2 based on analysis of the USEER, which was first released by the DOE in 2016. E2 was an original proponent of the DOE producing the USEER, and was a partner on the reports produced by the Energy Futures Initiative (EFI) and National Association of State Energy Officials (NASEO) after the Trump administration chose not to produce a USEER.
JOB DENSITY
Clean energy job density calculations for congressional districts used the U.S. Census Bureau 2022 County Business Patterns and the Bureau of Labor Statistics (BLS) 2022 Q4 QCEW employment data, analyzed and extrapolated by BW Research.
WHAT JOBS WE INCLUDE
We include are jobs in solar energy, wind energy, combined heat and power, bioenergy, non-woody biomass, low-impact hydro power, geothermal, electric vehicles, hybrid electric vehicles, plug-in hybrid vehicles, hydrogen and fuel-cell vehicles, clean energy storage, smart grid, micro grid, grid modernization, advanced biofuels, and energy efficiency including ENERGY STAR® and high efficiency appliances, efficient lighting, HVAC, renewable heating and cooling, and advanced building materials. The clean energy occupations covered in this report span economic sectors including agriculture, utilities, construction, manufacturing, wholesale trade, professional services, other services.
WHAT WE DO NOT INCLUDE
We do not include are jobs of workers who may spend some of their time in clean energy but a plurality in another energy sector. For example, workers employed by an excavation business might spend the majority of their time grading and preparing drilling pads for oil or gas rigs, but they also might spend a portion of their time preparing sites for wind turbines or large solar installations. If clean energy does not account for a plurality of their work, those workers would not be counted as being employed in the clean energy economy but would instead be counted as part of another energy sector. We also do not include any jobs in traditional transmission and distribution due to an inability to accurately segment out workers by electricity source, despite many of those jobs being critical to the increased electricity from renewable energy used by the grid. Lastly, we do not include jobs in corn ethanol, woody biomass, large or traditional hydroelectric, and nuclear because of environmental issues associated with those industries. Jobs in retail trade, repair services, water or waste management, and indirect employment or induced employment are also not included.