
South African economy expands by 0,4%
After contracting by a revised 1,1% in the fourth quarter of 2022, real gross domestic product (GDP) edged higher in the first quarter of 2023 (January‒March), expanding by an estimated 0,4%.1 The manufacturing and finance industries were the major drivers of growth on the supply side of the economy. The demand side was lifted by exports, with smaller positive contributions for household, government, and investment spending.
Manufacturing and finance were the main drivers of growth
Eight of the ten industries recorded growth in the first three months of the year (Figure 1), with manufacturing and finance, real estate & business services the largest positive contributors. Manufacturing output increased by 1,5%, adding 0,2 of a percentage point to GDP growth. The production of food and beverages was the main catalyst behind the industry’s positive showing.
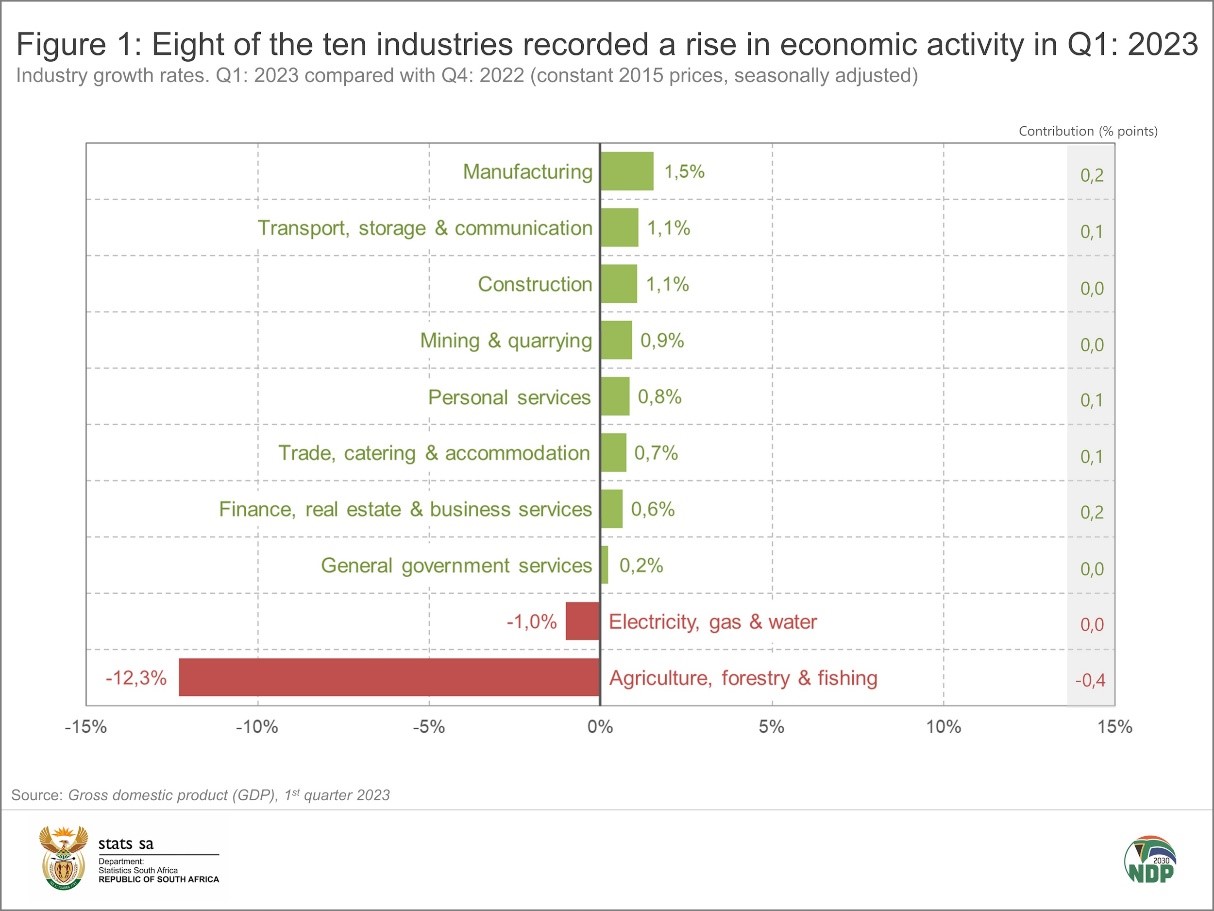
Finance, real estate & business services crept up by 0,6%, mainly driven by financial intermediation, insurance & pension funding, real estate and business services.
Personal services increased by 0,8%, driven by increased activity in community services.
A rise in rail freight and rail passenger transport helped the transport, storage & communication industry expand by 1,1%. Air transport, transport support services and communications also witnessed stronger economic activity, contributing to the industry’s positive reading.
After a disappointing end to 2022, mining activity turned positive in the first quarter. The rise in production was led by platinum group metals and gold.
The trade industry also registered upward growth, with positive results from wholesale trade, retail trade and catering & accommodation. Motor trade wasn’t as lucky, however, recording a decrease in economic activity.
Electricity, gas & water and agriculture contracted in the first quarter. Electricity, gas & water (utilities) registered its fourth consecutive quarter of decline, dampened by weaker electricity production and lower water consumption. The decline in utilities in the first quarter was an improvement from the decrease recorded in the previous quarter.
Agriculture slumped by 12,3%, weighed down by a decline in the production of field crops and animal products. Agriculture was the largest negative contributor in the first quarter, subtracting 0,4 of a percentage point from GDP growth.
Exports the main positive contributor to expenditure on GDP
Stats SA also measures the expenditure side of GDP, providing an indication of total demand in the economy. This includes measures of government consumption, household consumption, investment (gross fixed capital formation and changes in inventories), and net exports.
South African exports were buoyant in the first quarter, expanding by 4,1% (Figure 2). Export growth was mainly driven by increased trade in base metals, food (vegetable products, prepared foodstuffs & beverages) and machinery & electrical equipment.
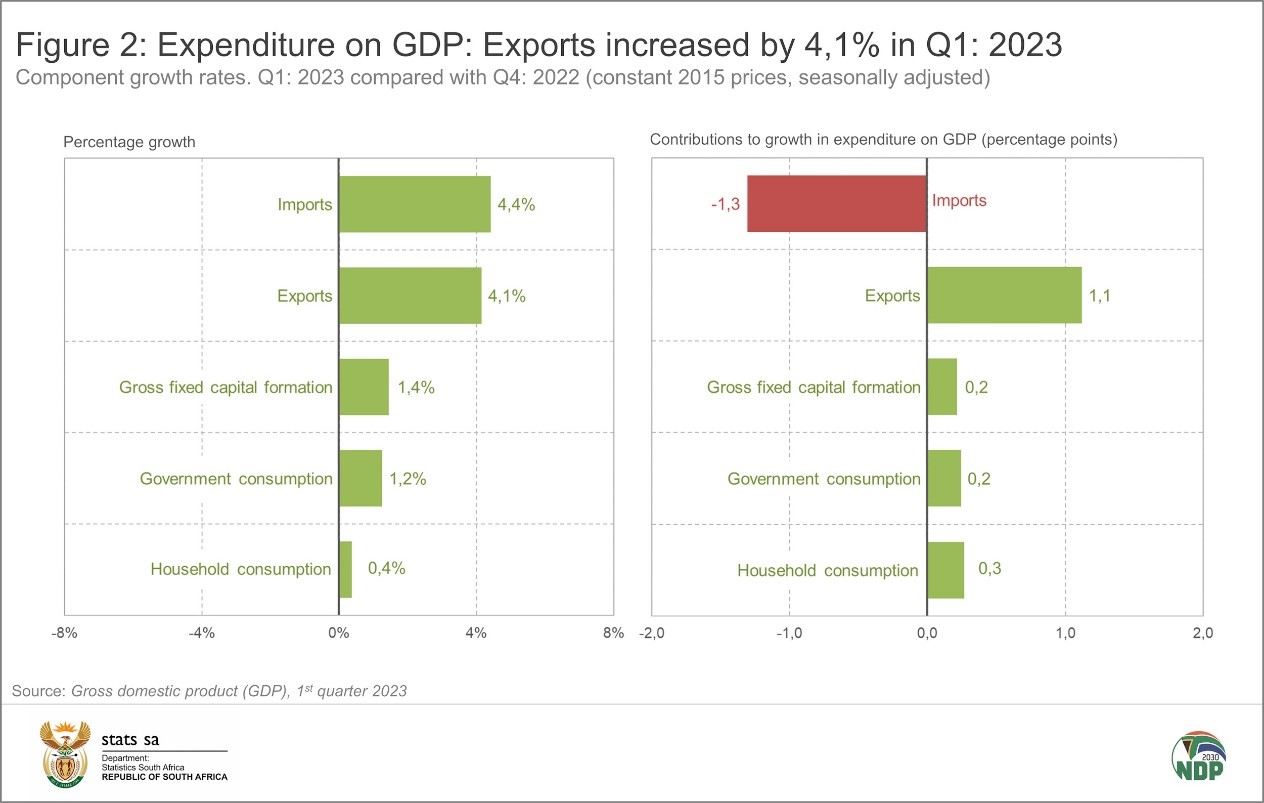
Mirroring the rise in construction on the supply side of the economy, gross fixed capital formation increased on the back of government investment. While the private sector and public corporations made smaller positive contributions, their impact was not on the same scale as government.
Households increased spending on restaurants & hotels by 6,9%. This budget item was the largest positive contributor to the 0,4% rise in overall household consumption expenditure.
Imports were also up in the first quarter, mainly driven by increased trade in machinery & equipment, chemical products, vehicles & transport equipment, and prepared foodstuffs & beverages.
GDP: a time series
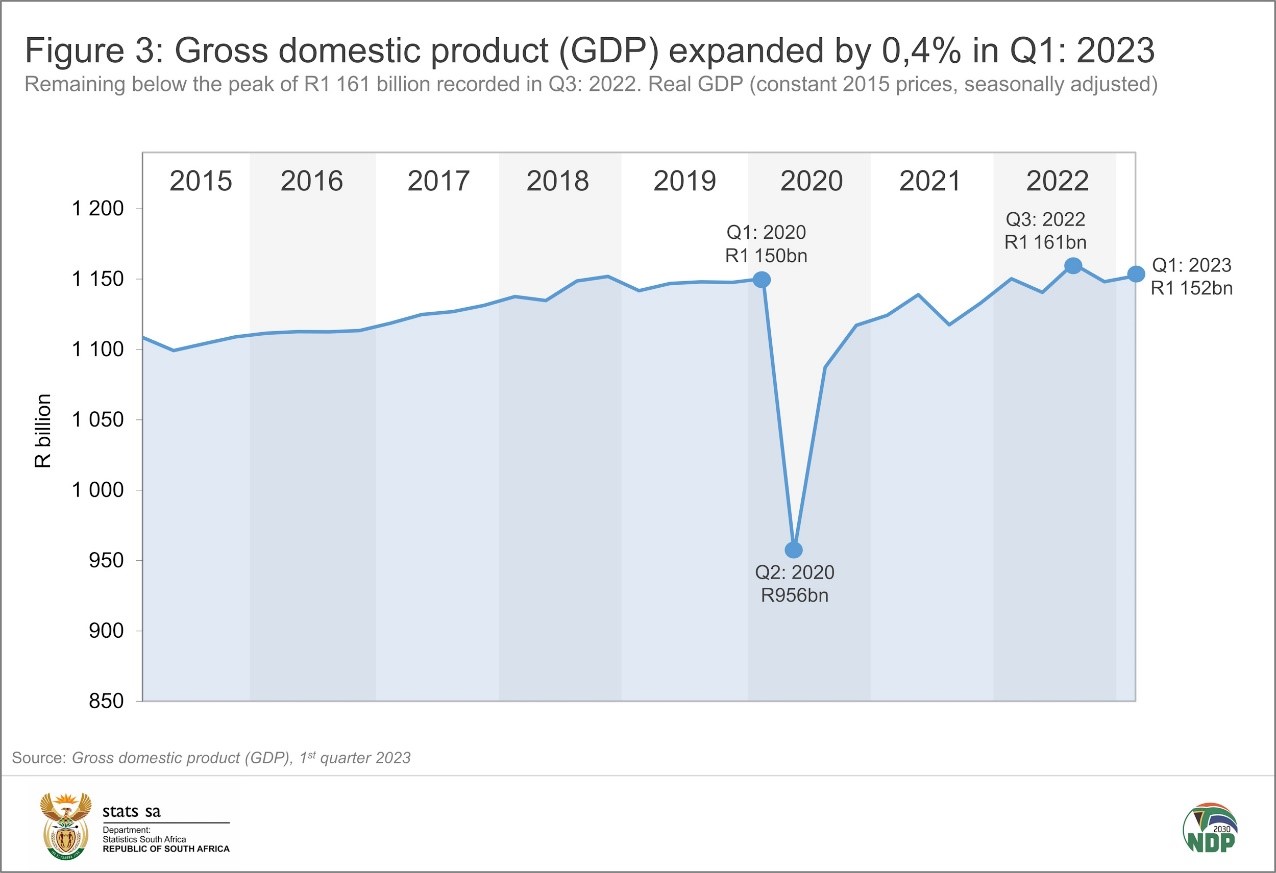
Those familiar with GDP media briefings may recognise Figure 3. Updated for the first quarter, the graph provides a quick overview of how the economy has performed since 2015. After the sharp downturn in the second quarter of 2020, real GDP (constant 2015 prices) took two years to return to pre-pandemic levels. In the third quarter of 2022, real GDP reached an all-time high of R1 161 billion. Despite the 0,4% rise in the first quarter of 2023, GDP remains below this peak.
For more information, download the latest GDP release, media presentation and Excel files here.
1 The quarter-on-quarter rates are seasonally adjusted and in real (volume) terms (constant 2015 prices).
Similar articles are available on the Stats SA website and can be accessed here.
For a monthly overview of economic indicators and infographics, catch the latest edition of the Stats Biz newsletter here.