SECOORA put together this page to highlight data and information related to Tropical Storm Elsa. It will be updated as new information becomes available and the track is more certain.
Please email laura@secooraorgpact.wpengine.com with additional resources to add!
On July 8 at 8:00 am EST, NOAA National Hurricane Center stated that Tropical Storm Elsa was located about 45 miles (70 km) west of Florence, SC, and about 150 miles (240 km) southwest of Raleigh, NC. Tropical Storm Elsa is moving north at 18 mph (30 km/hr).
On the forecast track, the center of Elsa moves north along the Carolinas Thursday, bringing heavy rainfall. Elsa will continue north, bringing heavy rainfall to the New England area Thursday and Friday. There are multiple watches and warnings in effect which can be found here.
Data from the National Hurricane Center indicate the maximum sustained winds remain around 40 mph (65 km/hr).
Click for official updates from the NOAA National Weather Service National Hurricane Center.
Hurricane Gliders
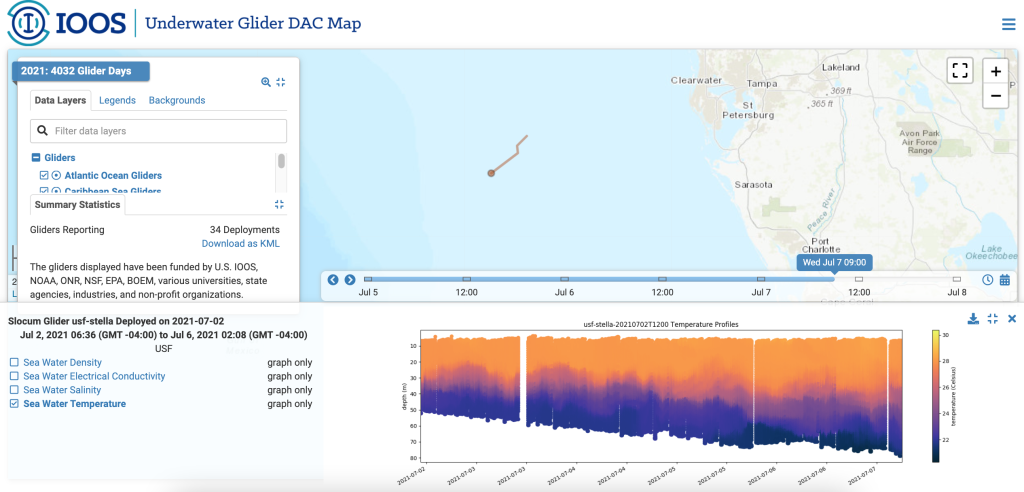
SECOORA gliders are capturing water column information ahead of Tropical Storm Elsa as it moves closer to the US. Data from gliders allow forecasters and scientists to improve predictions of the storm’s potential intensity.
The SECOORA glider Stella (operated by the University of South Florida College of Marine Science) was deployed into the Gulf of Mexico, off of the coast of Tampa on July 2. For more data currently being collected by the glider Stella, you can visit the IOOS Underwater Glider Map.
Follow the Data
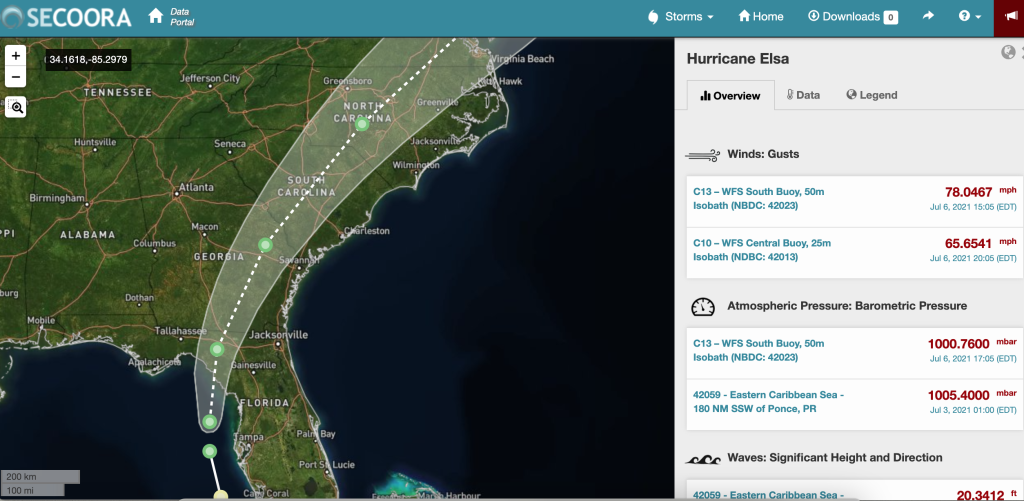
Eyes on the Storm pulls data from within 50 miles of Tropical Storm Elsa path and showcases the highest wind speeds and wave heights and lowest barometric pressure. Assets in the storm’s path recorded high wave heights and wind gusts off the coast of Florida.
Exploring Real-Time Data
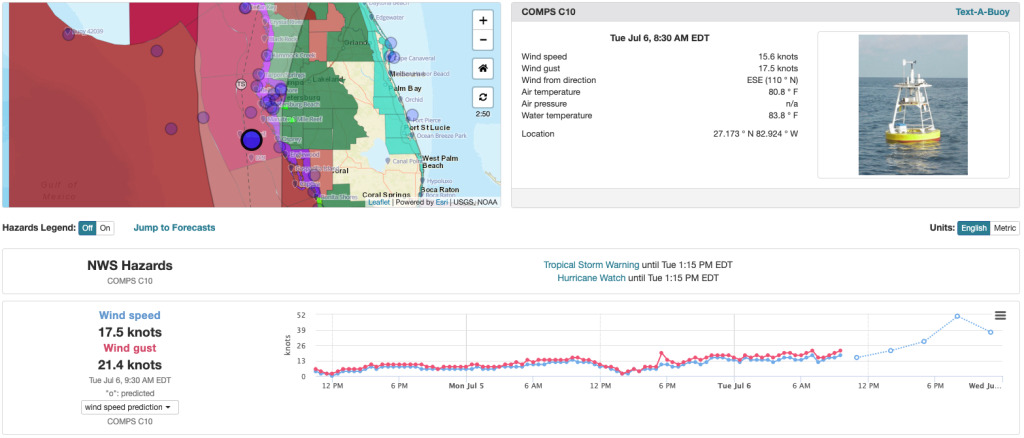
Explore Elsa data with the SECOORA Marine Weather Portal (MWP). View real-time weather hazards, tropical cyclone forecasts, and data from ocean and coastal observations as the hurricane approaches.
Integrated Data View of Elsa
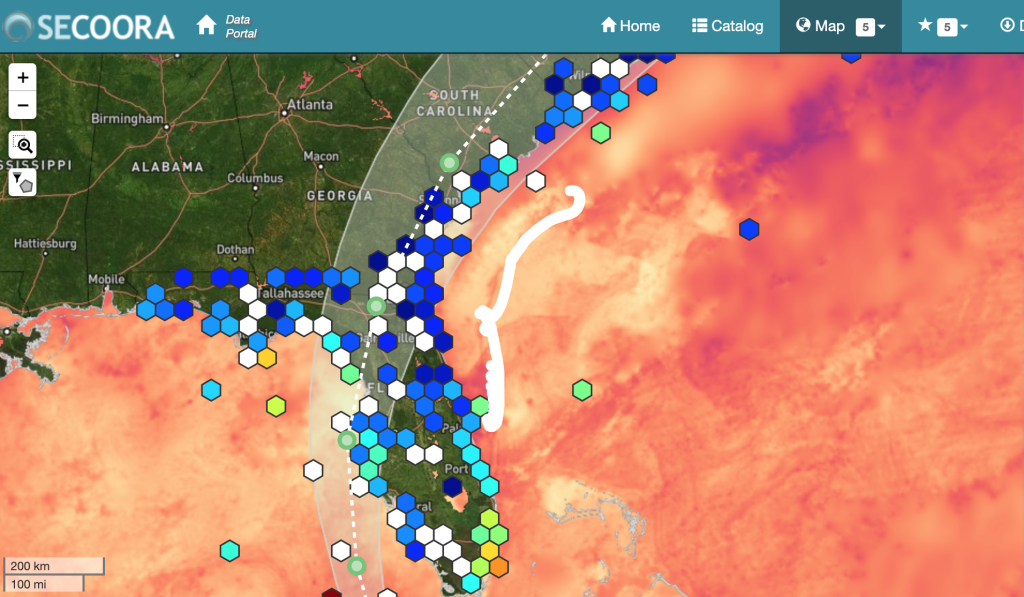
SECOORA’s Data Portal allows you to visualize Elsa’s track with other datasets.
Pictured above is the SECOORA Data Portal displaying the NWS storm track, SECOORA glider data, the NASA Sea Surface Temperature Analysis model, and real-time sensors layers.
Ocean Heat Content
Ocean Heat Content (OHC) is an integrated measure of ocean heat relative to the depth where 78ºF/26ºC water is located in the water column (Figure 1). For hurricanes, the higher the OHC value, the more heat that is available to the hurricane often translating into a stronger hurricane. The converse is also true, the lower the value, the less OHC that is available for the hurricane and can weaken a hurricane.
The satellite image to the right provides estimates of both sea surface temperature (SST) and sea surface height. The information is used to determine the depth of the warm water below the surface. Knowing the depth of the warm water allows researchers to estimate hurricane intensity since warm waters “fuel” hurricanes. This OHC research is operated by Nick Shay, University of Miami Rosenstiel School of Marine and Atmospheric Science.
Buoy Data
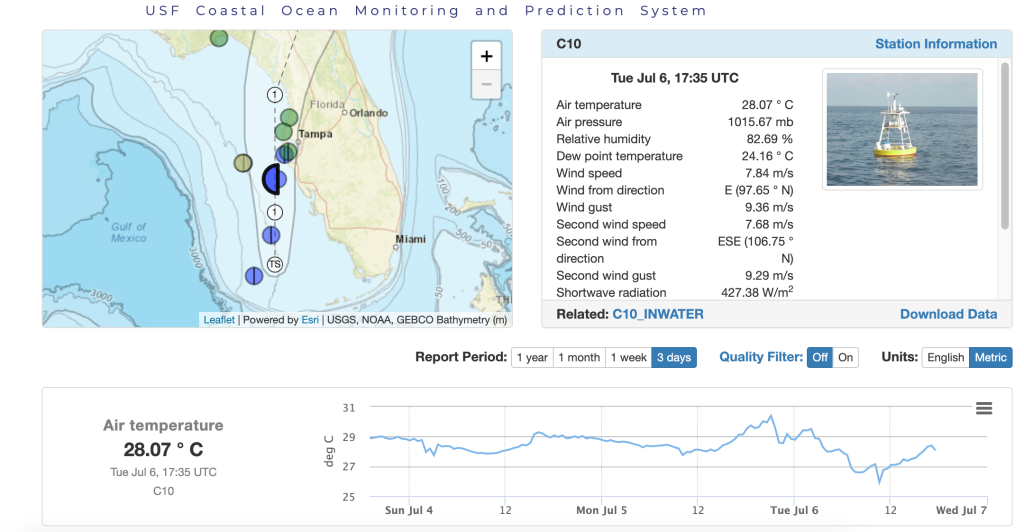
Tropical Storm Elsa’s projected path is expected to impact the southeast U.S. coast through the week.
As the storm moves north, explore mooring stations in the Gulf of Mexico. The buoys are operated by USF Coastal Ocean Monitoring and Prediction System.
Related news
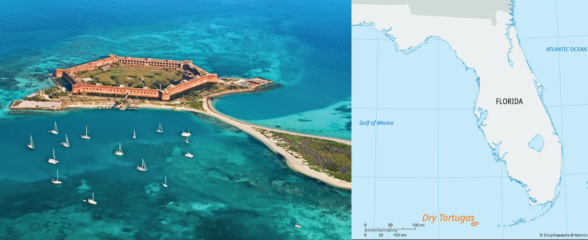
New High Frequency Radar at the Dry Tortugas National Park Improves Ocean Surface Current Measurements Across the Straits of Florida
A new CODAR Low-Power SeaSonde HFR has been deployed by the University of South Florida at Fort Jefferson on Garden Key to measure surface currents to improve understanding and prediction of the Gulf of Mexico Loop Current.

President Biden Proposes Significant Budget Cuts to IOOS for 2025
President Biden’s recent 2025 budget proposal slashed the funding allocated for the Integrated Ocean Observing System (IOOS) by 76%, which would effectively shut down coastal and ocean observing efforts.
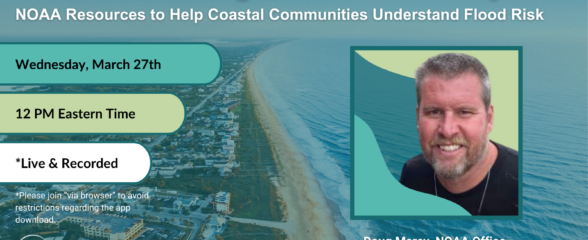
Webinar: NOAA Resources to Help Coastal Communities Understand Flood Risk
Join us Wednesday, March 27th at 12 PM Eastern Time for SECOORA's Coastal Observing in Your Community Webinar Series to hear from Doug Marcy with the NOAA Office for Coastal Management.