Article

Rapid Assessment of Tree Damage Resulting from a 2020 Windstorm in Iowa, USA

1
Northern Research Station, USDA Forest Service, Madison, WI 53726, USA
2
Iowa Department of Natural Resources, Des Moines, IA 50319, USA
*
Author to whom correspondence should be addressed.
Forests 2021, 12(5), 555; https://doi.org/10.3390/f12050555
Submission received: 19 March 2021 / Revised: 23 April 2021 / Accepted: 26 April 2021 / Published: 29 April 2021

Abstract

:
A need to quantify the impact of a particular wind disturbance on forest resources may require rapid yet reliable estimates of damage. We present an approach for combining pre-disturbance forest inventory data with post-disturbance aerial survey data to produce design-based estimates of affected forest area and number and volume of trees damaged or killed. The approach borrows strength from an indirect estimator to adjust estimates from a direct estimator when post-disturbance remeasurement data are unavailable. We demonstrate this approach with an example application from a recent windstorm, known as the 2020 Midwest Derecho, which struck Iowa, USA, and adjacent states on 10–11 August 2020, delivering catastrophic damage to structures, crops, and trees. We estimate that 2.67 million trees and 1.67 million m3 of sound bole volume were damaged or killed on 23 thousand ha of Iowa forest land affected by the 2020 derecho. Damage rates for volume were slightly higher than for number of trees, and damage on live trees due to stem breakage was more prevalent than branch breakage, both likely due to higher damage probability in the dominant canopy of larger trees. The absence of post-storm observations in the damage zone limited direct estimation of storm impacts. Further analysis of forest inventory data will improve understanding of tree damage susceptibility under varying levels of storm severity. We recommend approaches for improving estimates, including increasing spatial or temporal extents of reference data used for indirect estimation, and incorporating ancillary satellite image-based products.

1. Introduction

Natural disturbances cause extensive damage and mortality to trees in forested ecosystems, and as a result, may also accelerate or reinitialize forest successional pathways, and help establish a mosaic of stand age and stand structural classes on the landscape [1,2,3]. These changes can be beneficial to particular wildlife species but can also enhance the proliferation of insects, diseases, and shade intolerant invasive plants [4]. The frequency of forest disturbances appears to be increasing in the midwestern portion of the USA, particularly weather-related disturbance [5].
Disturbance types vary in frequency, intensity, and extent, and are often broadly divided into biotic (e.g., insects and diseases) and abiotic types (e.g., fire and weather), with various interactions occurring between types [6]. Insect and disease disturbances typically are relatively slow-moving with respect to the rate they travel across the landscape, and tree mortality is often not instantaneous. Fires range from slow-moving ground fires with minimal tree damage, to fast-moving crown forest fires that are completely destructive. Weather events are often intermediate in this respect. Like fires, they can occur with little warning; however, rather than being totally destructive, the effects can range from leaf stripping to broken branches to broken trunks to downed trees.
Different disturbance types and intensities necessitate different responses depending on how quickly they occur, how much warning was available, and the severity of damage. This can create a situation in which some intermediate level of response is warranted in order to salvage wood material for economic benefit or to reduce fuel loading for wildfire prevention, or to mitigate human risks associated with partially fallen trees.
With respect to weather-related disturbances, there are many types of events that lead to catastrophic forest damage and/or loss: ice storms [7,8,9,10], hurricanes [11,12,13], and wind events [14,15]. Mechanisms of windthrow, which includes any wind-induced damage such as stem breakage or uprooting, are reviewed in Gardiner et al. [16]. We draw a distinction here between wind events associated with hurricanes and those associated with other types of systems. Wind events can vary widely in intensity (wind speed), duration, and extent. Derechos are a particular type of wind event for which the defining characteristic is the large geographic area they cover. A definition of derecho proposed by Corfidi et al. [17] includes downburst clusters causing damage after preliminary storms have organized, with resulting swath being nearly continuous, at least 100 km wide and 650 km long.
Derechos are somewhat common in the central and eastern USA. Where derechos are most frequent, regions can experience 2 per year on average with a range of severity [18]. Because derechos are not uncommon and because they impact a relatively large area, these wind events have the potential for significant impact on forest land and can play a significant role in the composition and structure of forests. For example, Vaughn [19] documents the significant impacts of a 2009 derecho in the Ozark Highlands region in Missouri, uprooting and toppling a substantial volume of trees, particularly to the dominant oak (Quercus spp.) overstory. A 1999 derecho event removed up to 29% of the standing volume where it passed through the Boundary Waters Canoe Area and Wilderness in Minnesota and significantly increased fuel loadings [20,21]. We note the term derecho was not widely applied in the United States until relatively recently, and so the impact of historical derechos on forests may not be directly evident in literature; such events may be described as intense winds, severe storms, or other similar terminology.
When these events occur, effects can include significant loss of commercial timber and expensive removal and clean-up costs of urban trees. Because wind events are often expansive, local, state, and federal decision makers often require rapid access to information about storm impacts in order to inform response efforts. Changes to forests can be rapidly observed via field surveys, aerial surveys (as was done for this event), and various sources of aerial and satellite remote sensing imagery [22]. A number of recent satellite-based change detection approaches have focused on attributing the type of disturbance that is responsible for forest change and have found that wind events are detected less accurately than other types of disturbance [23,24,25]. In addition, satellite-based approaches provide little tree-level information. Therefore, a field, aerial, or field-aerial hybrid approach is preferred when rapidly assessing damage to inform response efforts.
Reliable estimates of tree damage can be obtained following remeasurement of natural resource inventory plots [3,20], or retrospective analysis of existing inventory data [26]. However, such approaches typically lag disturbance events by several years. Often after a catastrophic event, there is a need for timely information about the impact on a resource. The drivers for such information include needs to plan emergency response, to mitigate potential danger inherent in damaged areas, to plan for forthcoming insurance claims, and to determine the funding level of government support for affected areas. Regardless of the reason, we will hereafter use the term “rapid assessment” to discuss these situations. We also note a distinction between events that impact large geographic areas and those that are highly localized. The methods and resources required to rapidly assess large- and small-scale events are different. For example, the city of Houston, TX (USA), conducted a post-hurricane survey by re-visiting 305 trees that had been previously measured 6–7 years prior [27] and preliminary estimates of damage resulting from Hurricane Katrina were produced for a six-county area of Mississippi, USA, by combining elements of standard forest inventory with post-disturbance measurements of inventory plots [28]. However, such ground-based assessments may not be feasible for rapid assessments of larger geographic areas such as an entire state.
The capacity to produce rapid assessments seems to be highly variable, depending on the resource impacted and the type of disaster, and there are a variety of examples across different sectors. The infrastructure to produce rapid assessment of crop damage or losses is well-developed. The U.S. Department of Agriculture helped develop and maintain the Global Agricultural and Disaster Assessment System to help provide immediate information on disaster impacts to global yield and production in the agricultural sector [29]. A rapid assessment was produced after Cyclone Ian for the agricultural and fisheries sectors in Tonga [30]. In the forestry sector, there are rapid assessment protocols in place for wildfire events. For example, the Rapid Assessment of Vegetation Condition after Wildfire (RAVG) program uses regression models and satellite images to produce maps of vegetation conditions within 45 days of a fire on National Forest System lands in the US [31]. Examples of more generalized systems for near real-time forest disturbance monitoring include the Landsat-based Global Forest Watch, following the tree cover change detection approach of Hansen et al. [22], and ForWarn, which utilizes MODIS imagery to monitor for changes to forest cover [32].
Applications of remote sensing can be effective for rapid assessment in the wake of a disaster that completely removes part of the resource of interest [33], particularly if details about the population prior to the event were well-known. In such cases, the area affected can be observed using imagery, and combined with information on pre-disturbance conditions to estimate effects on a given resource. In the case of forestry and severe storms or wind events, trees may be killed directly, or trees may be only partially damaged, and damage severity is non-uniform across trees in an area due to heterogeneity in tree susceptibility and local wind intensity. As with several of the assessment approaches previously mentioned, post-hoc analysis of events can be conducted to build models that relate a satellite response to differing levels of removals or damage and then applied to future events. We describe those as model-based methods, and discerning the precision and bias of estimates derived from such approaches requires either a field-based reference sample [34] or higher-quality observations (e.g., low flying drone imagery or lidar to evaluate satellite-based predictions). We describe a design-based approach in which we utilize a probability-based sample, post hoc analysis, and an aerial survey to produce a rapid assessment of changes to forests after a derecho event. Rather than mapping the location and general severity of damage, we utilize the existing strategic forest inventory in combination with post-storm aerial survey to predict losses with respect to the forest resource.
On 10–11 August 2020, a derecho struck Iowa, USA, and adjacent states, delivering catastrophic damage to structures, crops, and trees. Sustained winds lasted nearly an hour over a large swath of central and eastern Iowa, and stronger wind gusts impacted portions of several Iowa counties (Figure 1). Response to this event necessitated rapid yet reliable estimates of damage to Iowa forest resources. Therefore, we developed and applied an approach of combining pre-disturbance forest inventory data with post-disturbance aerial survey to produce estimates of affected forest land area, and numbers of trees and total sound volume with new damage or mortality likely caused by the derecho.

2. Materials and Methods
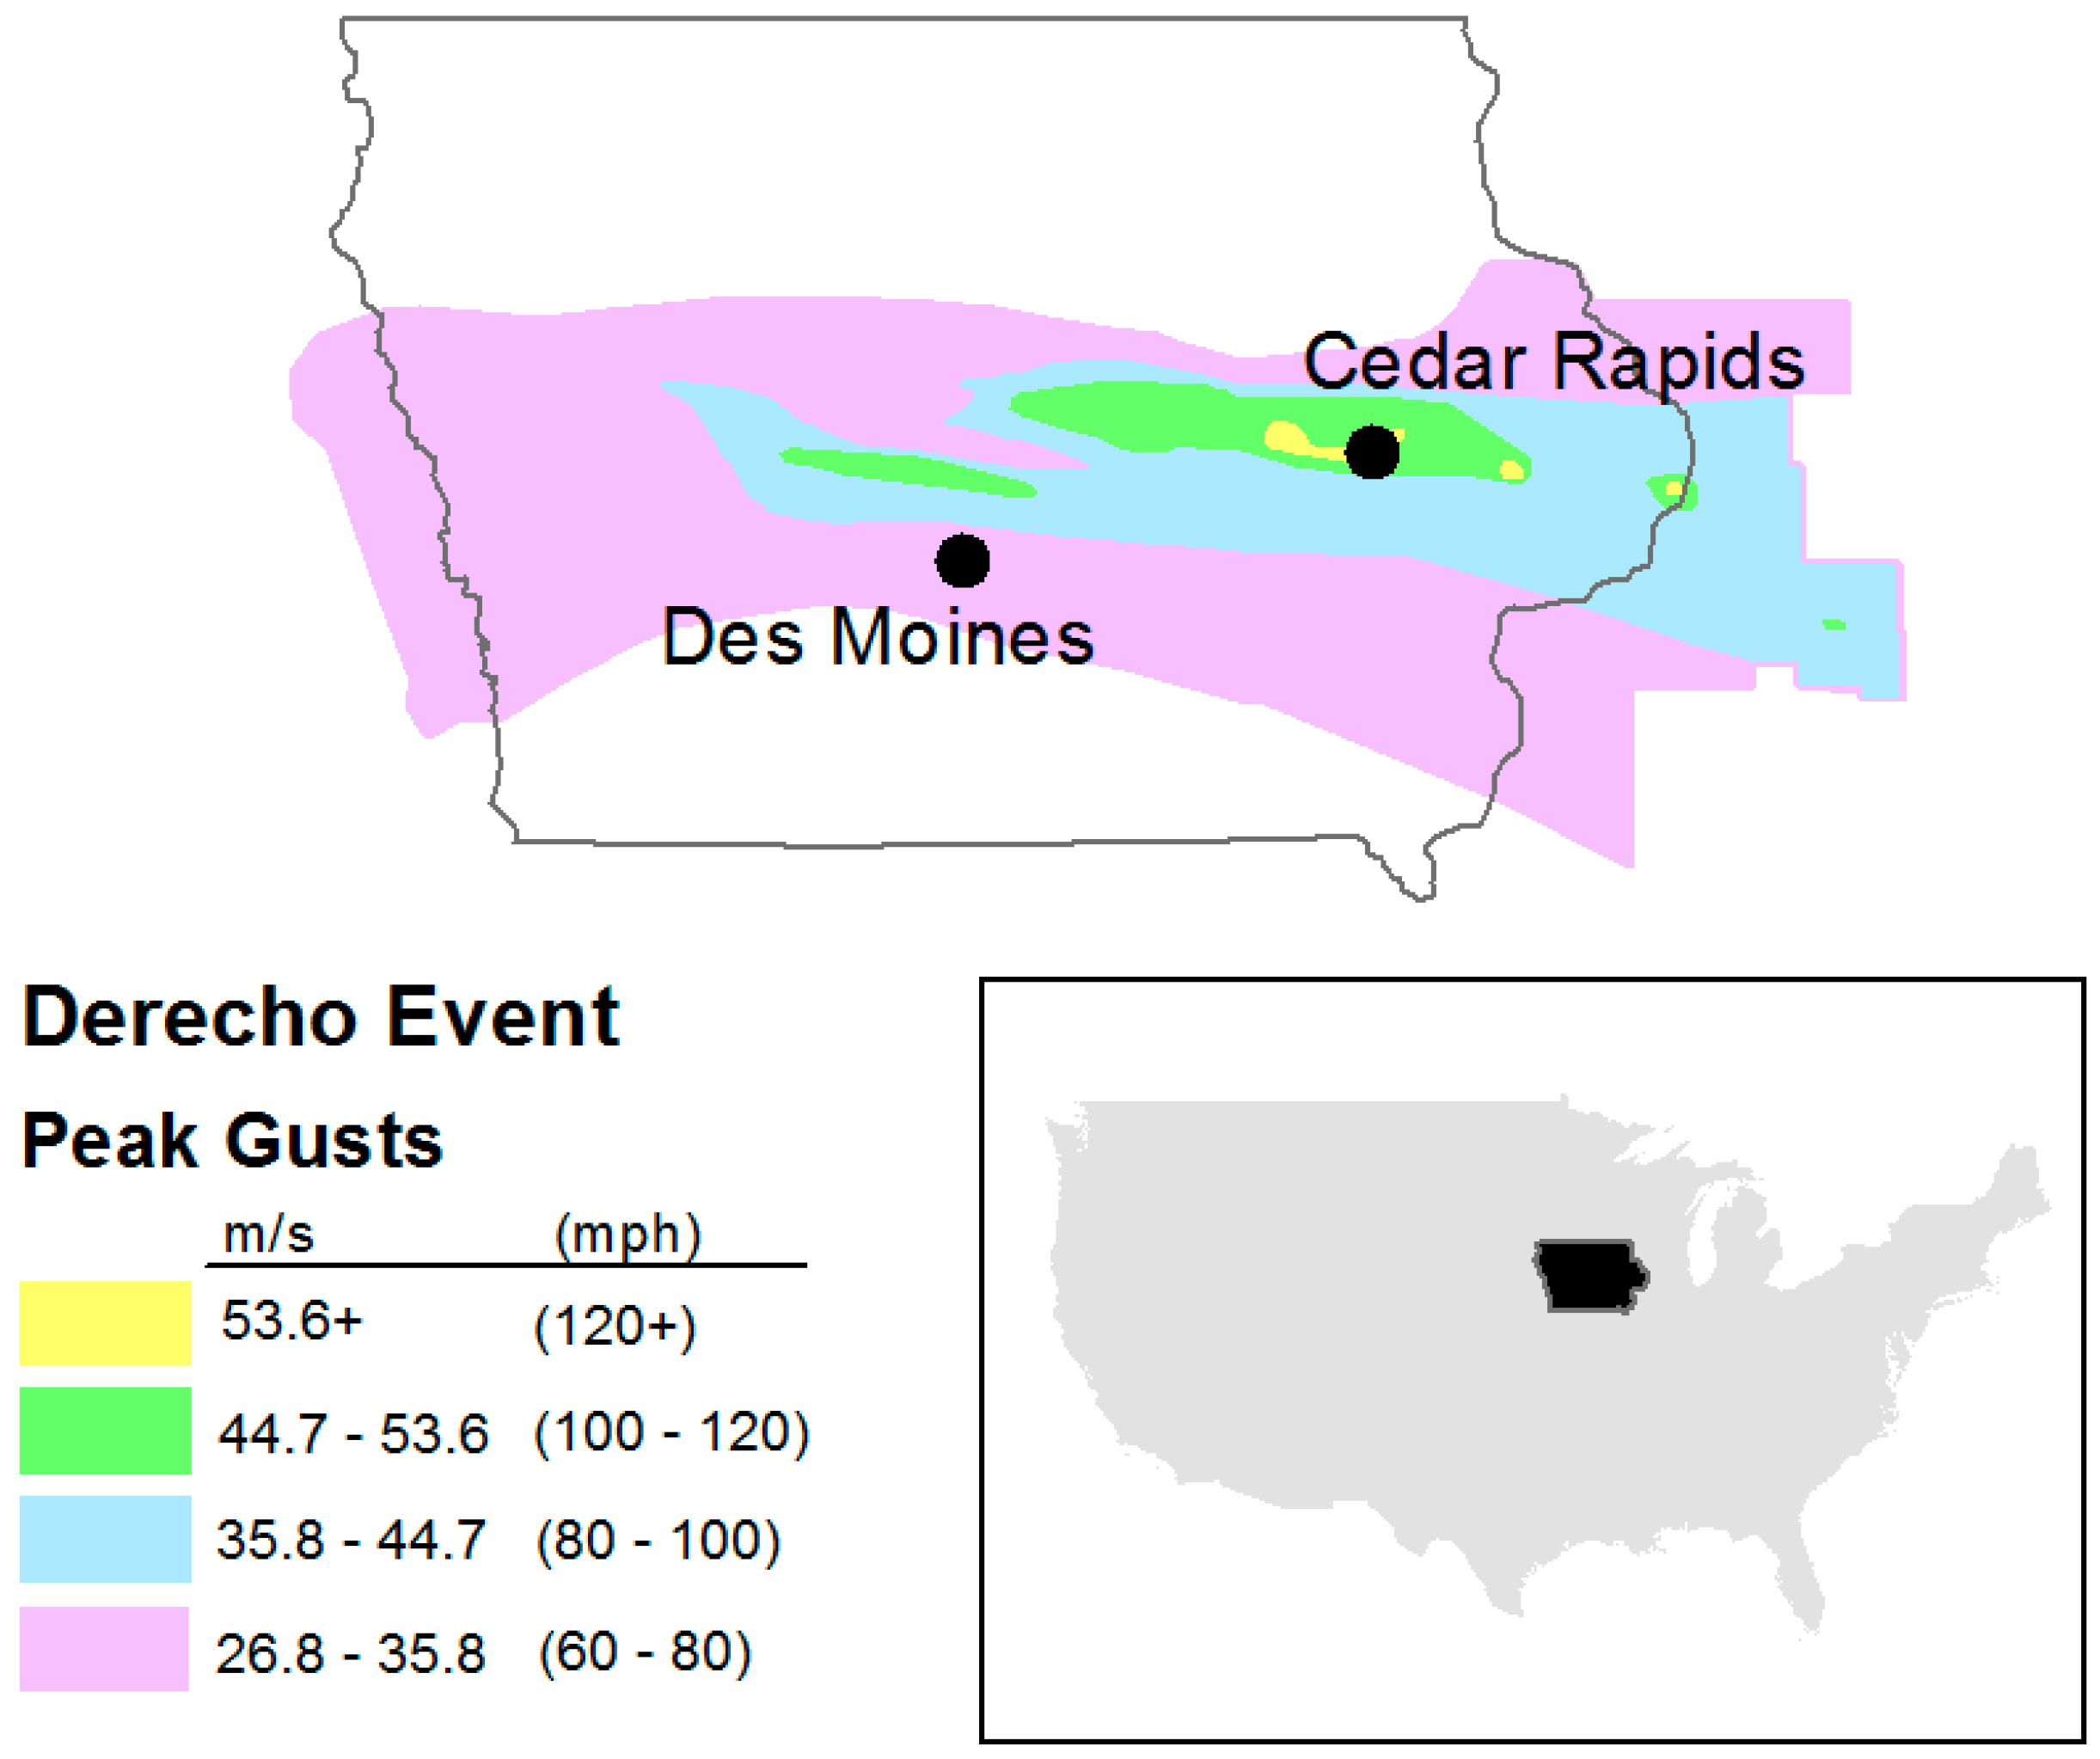
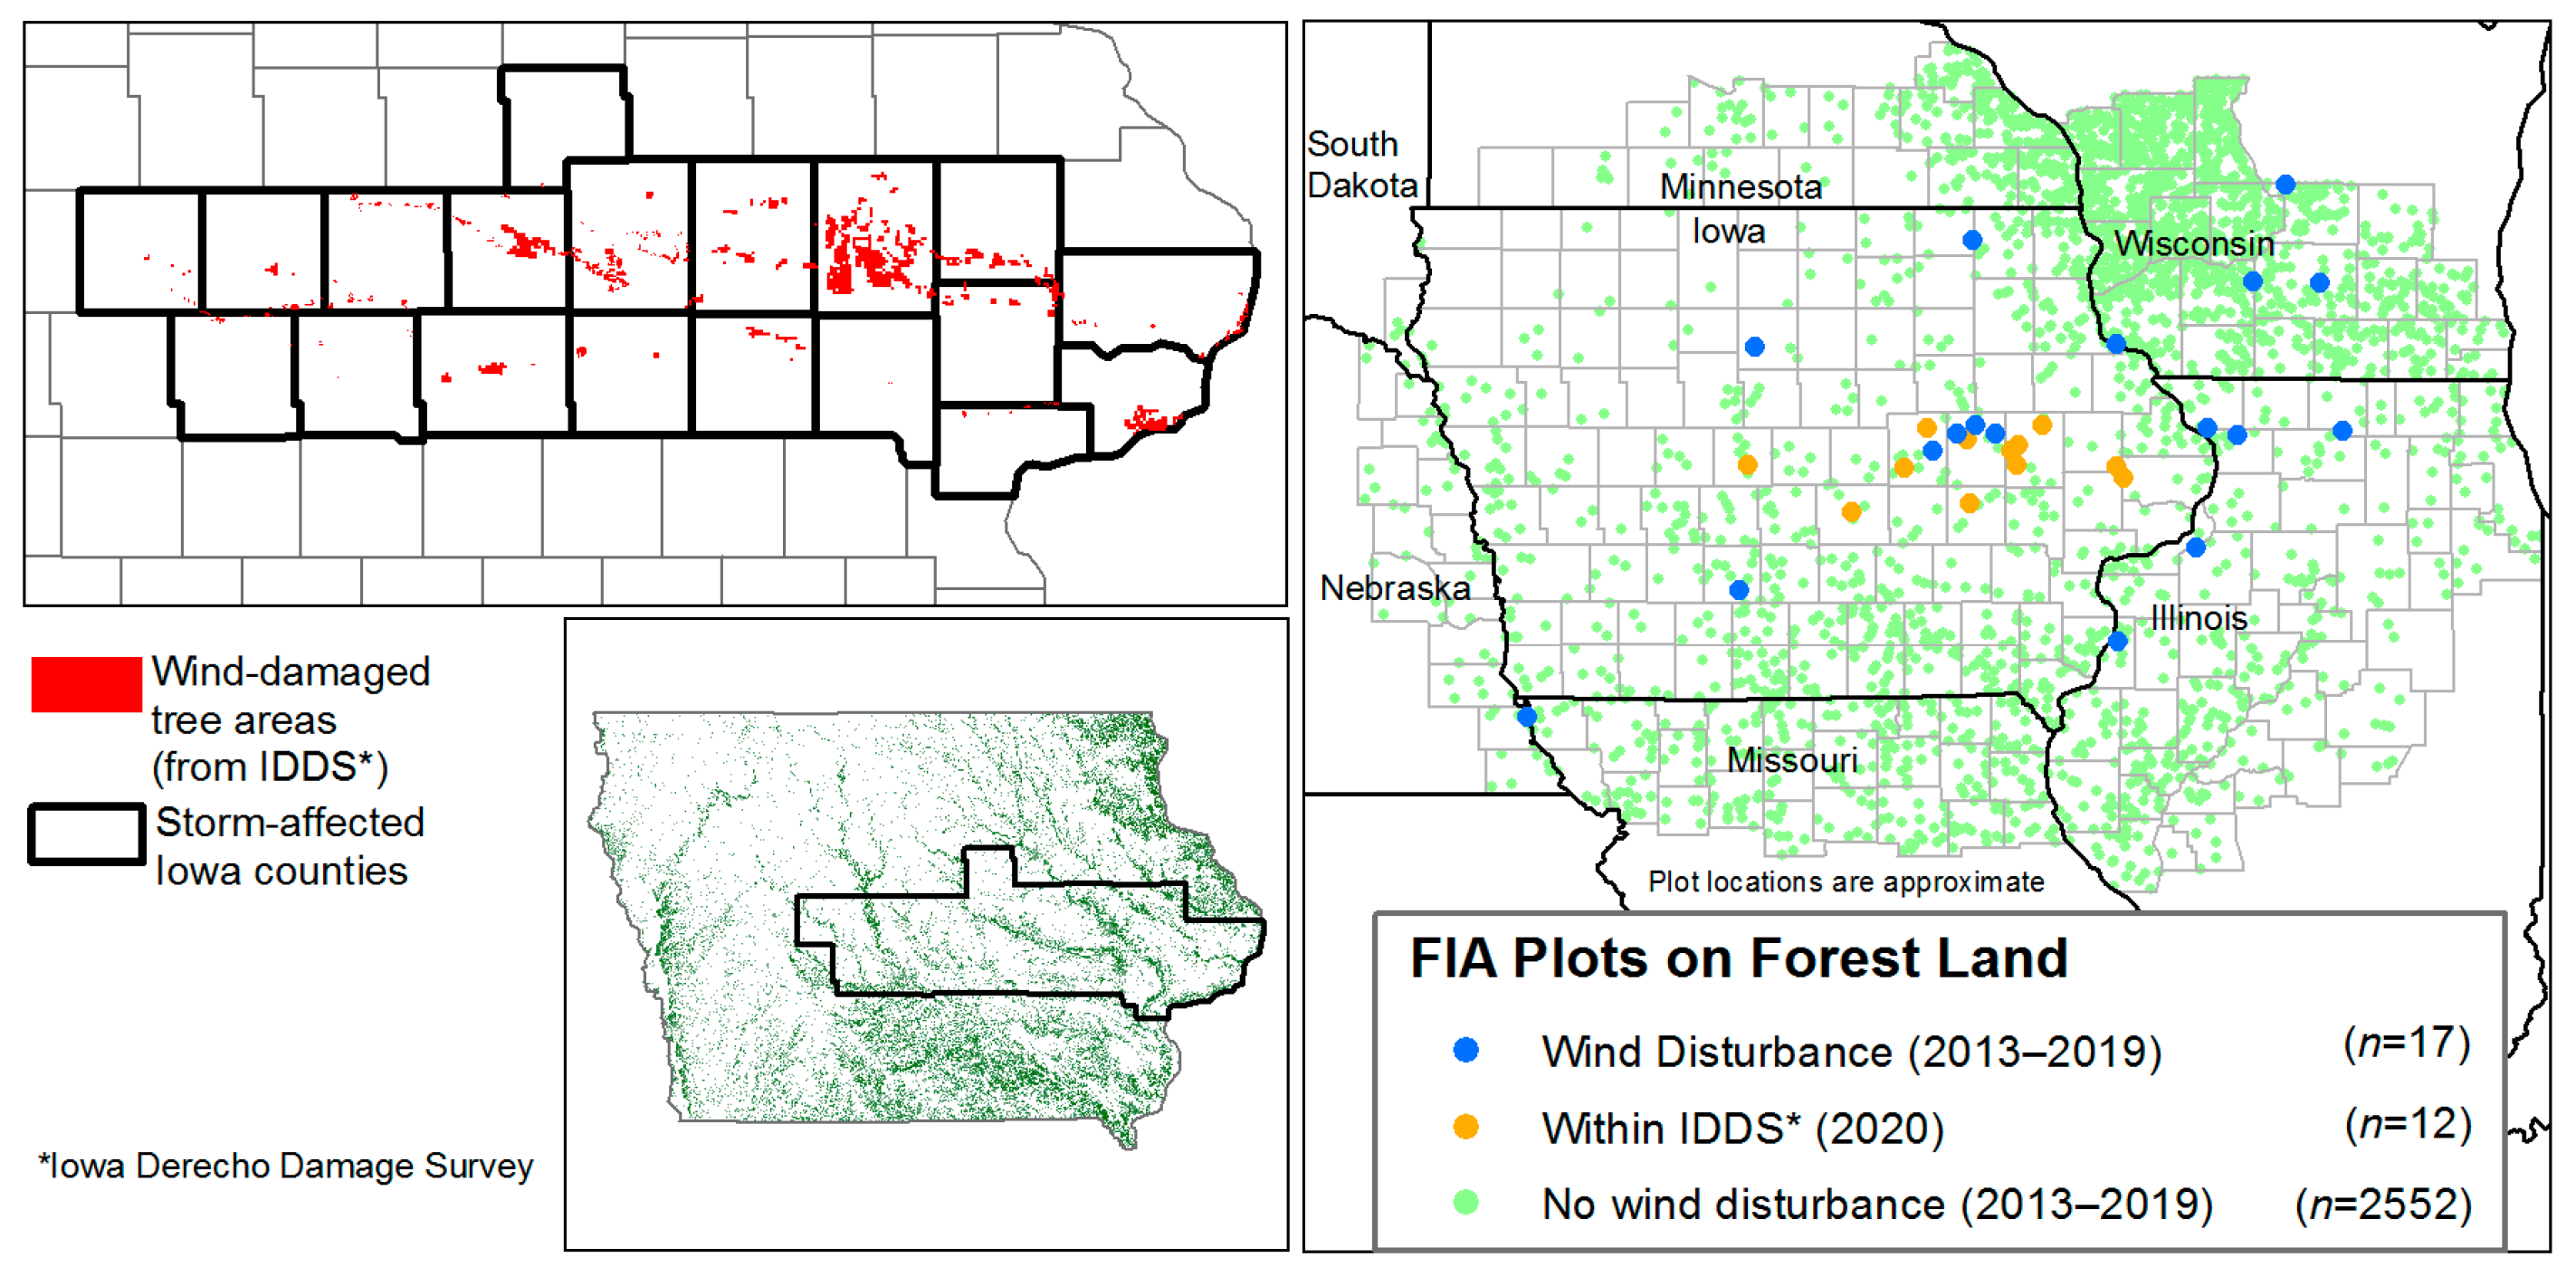
2.1. Study Area

The August 2020 Midwest Derecho impacted 19 Iowa counties (Benton, Boone, Cedar, Clinton, Dallas, Greene, Grundy, Iowa, Jasper, Johnson, Jones, Linn, Marshall, Muscatine, Polk, Poweshiek, Scott, Story, Tama) (Figure 2). Most of the study area falls within the Rolling Loess Prairies and Iowan Surface ecoregions [35]. These ecoregions are characterized by irregular to smooth plains and open low hills. Loess deposits range from thin in the Iowan Surface ecoregion, to thick deposits in the Rolling Loess Prairies. Historically occupied by tallgrass prairie and areas of oak-hickory forest, this 19-county area is now dominated by cropland and pasture, with remaining forest land characterized by Quercus spp., Carya spp., Ulmus spp., and Fraxinus spp. of large diameter and older age.

2.2. Data

2.2.1. Aerial Survey

The Iowa Department of Natural Resources, with assistance from the Maryland Department of Agriculture, collected Iowa Derecho Damage Survey (IDDS) data within the 19-county area between the 21 and 24 September 2020. A general description of aerial detection survey methods is reported in Johnson and Wittwer [36]. IDDS surveys were flown at an altitude of 1067–1372 m (3500–4500 feet), at speeds of 56.6 m/s (110 knots) (with some variation). Surveyors identified polygons where damaged trees were observed and assigned them to one of the following damage severity classes: light (4–10 percent), moderate (11–29 percent), severe (30–50 percent), and very severe (50+ percent) based on the percentage of trees damaged (Figure 2). These damage severity classes were used to validate ground-based estimates as described later in Section 2.3.4. The polygons identified in this survey merely had to contain damaged trees, not forest land as defined in Section 2.2.2.

2.2.2. Forest Inventory
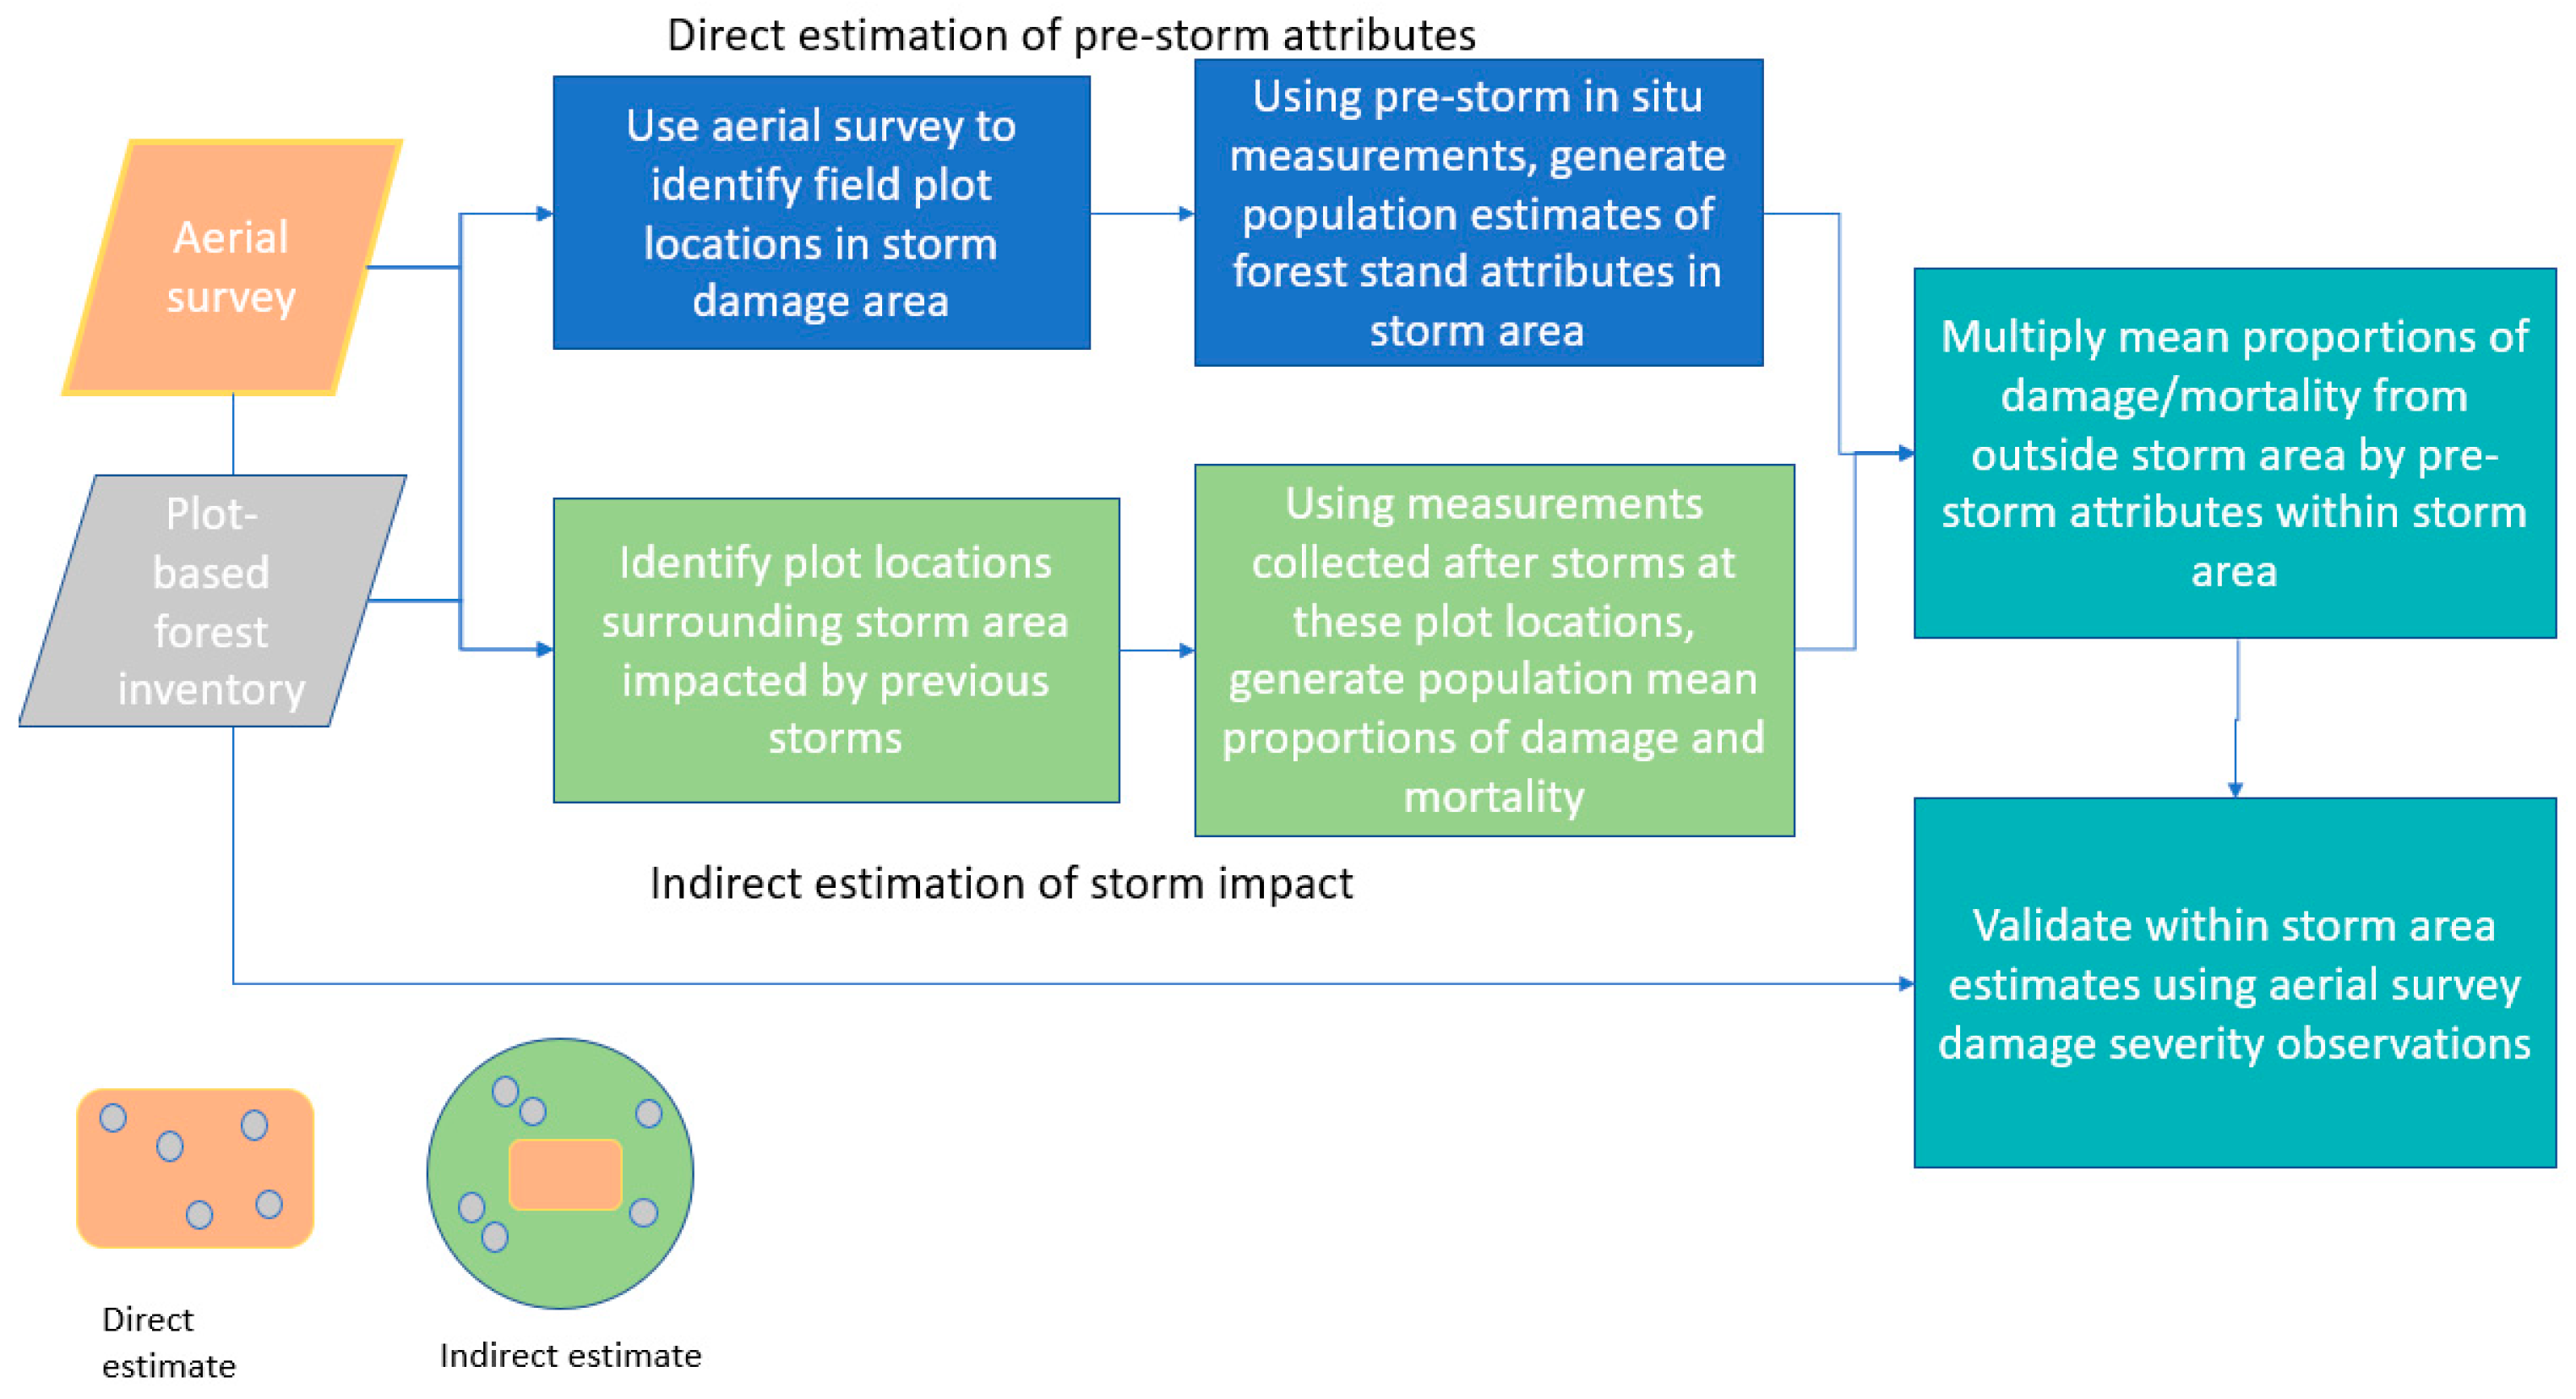
U.S. Department of Agriculture, Forest Service, Forest Inventory and Analysis (FIA) data support unbiased estimates of status and long-term trends in forest attributes. FIA defines forest land as land that has at least 10 percent canopy cover by live tally trees of any size or has had at least 10 percent cover in the past and has not been converted to another land use. To qualify as forest land the area must be at least 0.4047 ha (1 acre) in size and 36.58 m (120 feet) in width, although exceptions exist for certain strips of trees separated from qualifying forest land by roads and streams [37].
The FIA sampling design is based on a tessellation of the United States into hexagons of 2403 ha with 1 permanent plot established in each hexagon. Tree and site attributes (e.g., species, diameter, forest type) are measured in plots falling in forest land; in each plot, measurements are taken in four 7.32 m (24 feet) fixed-radius subplots [38]. Each plot’s area is subdivided, if necessary, by distinct stand attributes such as stand size and forest type, and these units are referred to as conditions. Damage to trees is incorporated into the FIA inventory at two levels: disturbance at the condition level and damage to individual trees. Up to three disturbances from abiotic and biotic agents (e.g., weather, insects, diseases, animals, and fire) are recorded when at least 25 percent of all trees or 50 percent of an individual species are affected in an area at least 0.4047 ha in size. For this study, FIA forest land conditions were considered to be affected by wind disturbance if any disturbance code was recorded as “Wind (includes hurricane, tornado)”.
Up to three damage agents (causes) are recorded for all live trees with a diameter at breast height (d.b.h.; 1.37 m above ground) of 12.7 cm (5.0 inches) or greater. If more than three damage agents are observed, the decision about which three are recorded is based on the relative impact on the tree [36]. For this study, live trees were considered to be damaged by wind agents if any damage agent code was recorded as “Wind”. The wind damage agent is defined as “Any damage to the terminal leader; damage ≥ 20% of the roots or boles with >20% of the circumference affected; damage > 20% of the multiple-stems (on multi-stemmed woodland species) with >20% of the circumference affected; >20% of the branches affected; damage ≥ 20% of the foliage with ≥50% of the leaf/needle affected”.
One cause of death (agent) is recorded for dead or removed trees with a d.b.h. of 12.7 cm or greater, but wind-specific mortality agents are not recorded for these trees. Therefore, we assumed that all dead or removed trees with agent code recorded as “Weather” were caused by wind if such trees also were located on forested conditions recorded as having wind disturbance. Removed trees are trees that were harvested but had a mortality agent of weather, indicating that they were salvaged as a result of weather damage.

2.3. Estimation

Estimation of storm impacts proceeded in two parts: direct estimation of pre-storm forest attributes within the IDDS damage polygons and indirect estimation of proportion of damage and mortality based on previous windstorms within the region surrounding the 19-county area (Figure 3). Estimates of storm impacts are then obtained by multiplying damage proportions by the pre-storm estimates. For example, if 2 million trees were present before the storm and the estimated damage proportion is 0.5, we would estimate 1 million damaged trees. Results were then validated against observed proportions of damaged trees from the aerial survey data. Additional details about each component of this process are described in the next three sub-sections. All estimates reported here are for forest land and do not include trees outside forests (e.g., windbreaks, shelterbelts, urban trees) [39].

2.3.1. Pre-Storm Estimates of Forest Attributes

A good practice for assessing land class change is to produce estimates based on reference data obtained through a probability sampling design [34]. FIA data and estimators meet this requirement [40]. All FIA-based estimates were produced under the assumption of simple random sampling, with post-stratification applied to increase precision of estimates [41]. Thus, estimates of forest land area, and pre-derecho estimates of numbers and volumes of trees in IDDS polygons are all based on a direct, post-stratified estimator. We used the IDDS to identify FIA sample plots that likely were affected by the derecho. Precise coordinates of FIA plot locations measured during 2013–2019 were spatially overlaid in a geographic information system (GIS) on IDDS polygons delineating 2020 survey grid cells to identify FIA forested plots intersecting survey grid cells with wind damage (Figure 2). Post-stratified estimates representing the IDDS damage areas were then generated from these field plot data. Attributes of interest included number and volume of trees ≥ 12.7 cm d.b.h., tree status (live, dead, removed), tree damage (wind damage in live trees, weather as a cause to dead or removed trees), and damaged trees with missing tops (to distinguish trees with stem damage from trees with only branch damage). Smaller diameter trees were omitted from analyses because seedlings have very low wind damage probability [41]. The distinction between stem vs. branch damage was determined by comparing FIA attributes of actual tree height vs. total height (including estimated height of broken/missing tops) [42,43]. For this study, height differences of at least 0.30 m (one foot) between actual and total were considered indicative of stem damage.

2.3.2. Indirect Estimation of Proportion of Tree Damage and Mortality

There were no tree remeasurement data available from after the storm with which to determine numbers and volume of trees having damage and mortality resulting from the 2020 derecho event. The aerial survey did provide some information about percentage of trees impacted via the damage severity classes as described in Section 2.2.1. We note that the aerial survey does not provide information regarding volume impacted. In addition, aerial survey data may not always be available after a storm event. For these reasons, we elected to withhold the damage severity information for validation of estimates in the storm-affected area rather than using them directly to inform estimates. Instead, we applied a technique referred to as indirect estimation [44] in which we utilized plot locations outside the IDDS damage polygons. We used GIS software to produce a 200 km radius buffer surrounding the outer perimeter of 19 Iowa counties, then selected counties whose geographic centroids were located within the buffer (n = 221) (Figure 2). This buffer represented an area that is ecologically similar to the IDDS damage polygon locations and with similar severe weather patterns.
Within that 221-county buffer area which intersected Iowa and several surrounding states, we identified FIA plot locations for which a wind disturbance was recorded on a field visit in the period from 2013 to 2019 (Figure 2).
We generated population estimates for the same attributes of interest as we did for the IDDS polygons.
From these estimates, we calculated mean annual proportions of trees and volume within each condition/status/damage/breakage category which we assumed to be representative of damage occurring on FIA plots affected by the 2020 derecho. Because standard FIA estimators for removals and mortality produce estimates on an average annual basis, we converted these estimates to represent the 2013–2019 sample period, multiplying by per-state average remeasurement increments which averaged 5.7 years across all states (range: 4.8 (MN) to 6.6 (SD)). We also produced corresponding estimates of uncertainty (1 standard error (SE) of the estimate).
While there is a lot of variability between wind storms, and it is difficult to have complete information on a particular site’s susceptibility to storm damage when working over large areas, we note that this indirect estimation approach relies on the mean of a population to represent the damage for this one particular storm. We examine the validity of that assumption by comparing to observations from the aerial survey.

2.3.3. Estimating Impact of Midwest Derecho

To obtain estimates of damage and mortality resulting from the derecho, we multiplied proportions of wind damage and mortality from the indirect estimate by pre-storm estimates of number of trees and sound volume within the IDDS. Each of the direct estimates of attributes within the IDDS polygons have their own estimates of uncertainty (standard error), but we report estimates for derecho damage and mortality within the IDDS polygons without standard errors.

2.3.4. Validation of Estimates Using Aerial Survey Damage Severity Data

The estimates of pre-storm forest attributes are based on FIA’s sample design and rely on an unbiased, post-stratified estimator. Estimates of standard errors were calculated, and we therefore, we have some indication as to the precision of these estimates. However, the representativeness of the indirect estimates of proportion of damage and mortality is not known. In order to examine this assumption, we utilized the aerial survey damage severity data. As described in Section 2.2.1, each IDDS damage polygon was attributed with a light, moderate, severe, or very severe level of damage. Each category corresponded to a range of trees affected (e.g., 30–50% of trees present). We emphasize here that the observations relate to number of trees rather than volume, basal area, or some other measure of prevalence.
We assigned the FIA plots intersecting IDDS polygons to their corresponding damage severity category and generated estimates for number of trees in each class. We then used the midpoints of the damage severity % affected ranges to stand-in for the proportion we previously calculated using the indirect estimation method that relied on wind-disturbed plots in the 221-county region. We multiplied the midpoint values by the pre-storm number of trees and summed across all aerial survey damage severity classes to arrive at a total number of impacted trees. We note here that the aerial survey observations can include both damaged and mortality trees. We compared this total number of impacted trees based on the aerial survey data to the total number of damaged and mortality trees estimated only from plot data as described in previous sections using a relative difference formula:
%   d i f f e r e n c e = T r e e s   i m p a c t e d p l o t s T r e e s   i m p a c t e d a e r i a l T r e e s   i m p a c t e d a e r i a l

3. Results

3.1. Indirect Estimate

Forest land area in the 221-county region was estimated at 3.8 million ha (±55 thousand), of which 0.9 percent (34 thousand ha, ±9 thousand) was affected by wind disturbance during 2013–2019. Regionwide, about 44% of trees and 54% of volume on 34,374 ha (±8679) of forest land were damaged or killed due to wind damage or weather agents during 2013–2019 (Table 1 and Table 2). The number of mortality or removal trees associated with storm damage was roughly double the number of live trees damaged (branch and stem damages combined). Similarly, for trees exhibiting wind-impacts, the total volume in mortality and removal trees was greater than the total volume in live, damaged trees. Compared to branch damage, the rate of stem damage on live trees was lower, both for numbers and volume of trees (Table 1 and Table 2).

3.2. Midwest Derecho

About 2.67 million trees and 1.67 million m3 of sound bole volume were damaged or killed by the 2020 derecho, based on estimates for FIA plots within IDDS boundaries, weighted by prior proportions of regional tree damage (Table 3). Wind-damaged numbers and volumes of live trees were lower than for mortality/removals (Table 3), which is similar to regional estimates (Table 1 and Table 2). Estimated number of live trees were larger for branch damage than for stem damage classes (Table 3).

3.3. Validation

Most of the plots within IDDS polygons coincided with the aerial survey severe damage category with a midpoint value of 40 percent. This is similar to our overall percentage from the indirect estimate of 43.82. The estimate of the total number of trees damaged using the aerial survey observations was 2.35 million compared to 2.67 million using the indirect, plot-based approach (Table 4). This is a relative difference of 12 percent.

4. Discussion

4.1. Observations Regarding the 2020 Midwest Derecho

Regional percentages of wind-based tree damage and mortality were higher for tree volume than for numbers of trees. At a given windspeed, larger trees with larger, higher crowns are more susceptible than smaller, lower trees [45]. Similarly, larger mean stem diameters and older stand ages are associated with increased damage probabilities [46]. Many similar relationships are summarized in a review by Beach et al. [47]. Because numbers and volumes of trees are inversely related, damage is expected to be relatively higher in fewer, larger trees, as was observed in this study. Live tree stem breakage was about four percent lower than for branch breakage, for both numbers and volumes of trees, perhaps due to the spreading crown configuration of large hardwood trees, resulting in higher probabilities for damage in peripheral branches than in main stems. This relationship may not hold for other study areas dominated by conifer species [43,48]. In a post-Katrina assessment, Glass and Oswalt [28] reported high windthrow (blowdown) being more common in deciduous forest types, while wind-shear (stem breakage) was recorded only in coniferous stands.

4.2. Caveats, Cautions, and Lessons Learned Regarding Estimation for Rapid Assessment

We acknowledge that determining probabilities of tree-level damage or mortality is one of the more difficult requirements for our estimation approach. A statistical sample of recent past wind damage and mortality plots was assumed to represent an independent statistical sample of current forest conditions under the following requirements: past and current sample plots have (1) consistent sample design, (2) consistent plot design, (3) independence (different sets of plots—no overlap), (4) similar geography (similar ecological conditions and weather patterns), and (5) occur in “wind disturbance” conditions (for which the minimum threshold of trees impacted eliminates minor wind events). Disturbance conditions represent stand-level attributes of forest area, while damage and mortality conditions represent tree-level attributes. We assumed that the aerial survey attribution of wind disturbance was consistent with the inventory plot attribution of wind disturbance conditions. Because tree-level wind damage and mortality was not available post-event from neither inventory plots (no remeasurement) nor aerial survey, we assumed that when both past and current inventory plot data were constrained to wind conditions at the stand scale, that past tree-level wind damage was representative of current tree-level wind damage. Of course, there is variability in damage severity, even within the same disturbance event. For past conditions we estimated not only the percentage of trees damaged or killed, but also the corresponding uncertainty of those estimates, with standard errors of about 20–30%. A substantial portion, but not all of the past wind disturbance observations were associated with known past derecho events. We could not confirm whether or not past derecho or non-derecho wind disturbances resulted from the same storm intensity (wind speed and duration) as the current example derecho.
Probabilities of mortality and removals obtained from the period 2013–2019 were based on remeasurements occurring over multiple years, and FIA protocols necessitate retrospective attribution of damage and mortality agents. Depending on how soon a plot is assessed after the inciting event, some mortality and removals attributable to the disturbance may not be observed if, for example, trees succumb to damage effects after the post-event plot assessment. In such cases, trees would be recorded as damaged but labeled “live” due to the lag in mortality. However, given the 7-year remeasurement cycles in this study, the proportion of mislabeled (delayed) mortality events would be relatively small.
In the absence of post-disturbance forest remeasurement data, rapid assessment of 2020 Midwest derecho damage was produced from a combination of pre-storm FIA data and post-storm aerial survey data. A preferable approach would be to collect in situ data on sample field plots (FIA and/or others) within the derecho area of interest [28]. However, insufficient time, funding, and access concerns prohibited collection of such data prior to conducting this analysis. Such estimates will become available in future years as FIA permanent plots are remeasured. We recommend additional analysis of existing FIA data to obtain a priori information of factors affecting tree damage susceptibility, which can be applied to future rapid assessments.
It was encouraging to observe relatively high agreement between the IDDS damage polygons and the weather map areas identified as experiencing wind gusts exceeding 44.7 m/s (100 mph), suggesting that tree damage detected via aerial survey was associated with independently modeled higher wind speeds. Thus, in the absence of a post-damage aerial survey like IDDS, generalized wind speed maps may serve as surrogates for delineating geographic extents in which reference data like FIA sample plots can be selected for estimating damaging effects of disturbances [49]. We did not test that approach in this study, but we recommend such comparisons for future research.
Estimates of pre-storm attributes were based on a direct, post-stratified estimator, but from relatively small numbers of FIA sample plots; consequently, estimates for many categories had high estimates of statistical uncertainty. Estimates of 2020 Midwest Derecho damage borrowed strength from observations outside the storm-impacted area to determine rates of damage with which to weight pre-derecho tree numbers and volumes. Therefore, these estimates were generated using an indirect estimation approach. We recommend additional research on the use of this and other small area estimation approaches for supporting rapid assessment of storm damage, particularly for estimating standard errors of indirect estimates.
Potential operational approaches for increasing sample sizes under our approach are to expand either the spatial or temporal extent of pre-storm reference data. In this study, spatial extent was increased by using a larger radius buffer that included additional plots from surrounding states. This increased sample sizes proportional to the increased forest area sampled because sampling intensities were consistent between states, with the exception of Minnesota counties having double intensity samples, but where no wind-disturbed conditions were recorded. However, tree damage proportions can vary over geographic space [50], potentially leading to spatially unrepresentative proportions with increasing geographic distance. Temporal extent could be lengthened by including plot measurements from one or two prior periods (e.g., Iowa plots measured during 2008–2012 or 2003–2007), thereby doubling or tripling the number of observations from which wind damage rates could be estimated. A technical challenge of this approach is that definitions of FIA tree damage codes have changed over time, leading to potential thematic mismatches between previous and current damage classes [51]. We recommend careful consideration before applying either of these approaches.
An alternative approach to improving the precision of estimates would be to utilize contemporaneous satellite observations that provide some information about conditions after the disturbance. Such data could be used either within the existing post-stratification approach or by utilizing a model-assisted estimator [52,53]. There are challenges with availability of such imagery. For example, prolonged cloudy conditions following major storm events often prevent the acquisition of suitable optical images. However, improved availability of satellite-borne radar data has mitigated this problem, to a degree. L-band radar has been found to be sensitive to aboveground biomass and can penetrate canopy and provide information on larger woody branches and tree trunks [54].
The method described here provides an alternative that is based on existing field observations, assumptions about the representativeness of prior, nearby wind events, and requires information about the location of the event to be assessed. While the estimates have large uncertainty, this rapid assessment approach may be a suitable trade-off when damage information is needed quickly after a storm and it is impractical to gather new information whether by field observation, aircraft, or satellite on a short timeline.

Author Contributions

Conceptualization, T.C.G., M.D.N. and T.E.F.; methodology, M.D.N., T.C.G., G.C.L. and S.A.P.; validation, M.D.N. and S.A.P.; data curation, T.C.G., M.D.N. and G.C.L.; writing—original draft preparation, T.C.G., M.D.N. and G.C.L.; writing—review and editing, T.C.G., M.D.N., G.C.L. and R.S.M.; visualization, T.C.G. and G.C.L. All authors have read and agreed to the published version of the manuscript.

Funding

This research received no external funding.

Data Availability Statement

FIA data and tools can be found at: https://www.fia.fs.fed.us/tools-data/index.php, accessed on 28 January 2021.

Acknowledgments

This work was supported by the U.S. Department of Agriculture, Forest Service. The authors thank a multitude of Forest Service staff, reviewers, and partners who have contributed to the data collection and research and/or greatly improved the manuscript.

Conflicts of Interest

The authors declare no conflict of interest.

References

  1. Frelich, L.E. Forest Dynamics and Disturbance Regimes, Studies from the Temperate Deciduous Forests; Cambridge University Press: New York, NY, USA, 2002. [Google Scholar]
  2. Abrams, M.D.; Scott, M.L. Disturbance-mediated accelerated succession in two Michigan forest types. For. Sci. 1989, 35, 42–49. [Google Scholar]
  3. Holzmueller, E.J.; Gibson, D.J.; Suchecki, P.F. Accelerated succession following an intense wind storm in an oak-dominated forest. For. Ecol. Manag. 2012, 279, 141–146. [Google Scholar] [CrossRef]
  4. Daniels, M.K.; Larson, E.R. Effects of forest windstorm disturbance on invasive plants in protected areas of southern Illinois, USA. J. Ecol. 2020, 108, 199–211. [Google Scholar] [CrossRef]
  5. Wilson, D.C.; Morin, R.S.; Frelich, L.E.; Ek, A.R. Monitoring disturbance intervals in forests: A case study of increasing forest disturbance in Minnesota. Ann. For. Sci. 2019, 76, 78. [Google Scholar] [CrossRef]
  6. Vogt, J.T.; Gandhi, K.J.K.; Bragg, D.C.; Olatinwo, R.; Klepzig, K.D. Interactions between Weather-Related Disturbance and Forest Insects and Diseases in the Southern United States; U.S. Department of Agriculture Forest Service, Southern Research Station: Asheville, NC, USA, 2020; p. 37.
  7. Lafon, C.W. Ice-storm disturbance and long-term forest dynamics in the Adirondack Mountains. J. Veg. Sci. 2004, 15, 267–276. [Google Scholar] [CrossRef]
  8. Bragg, D.; Shelton, M.; Zeide, B. Impacts and management implications of ice storms on forests in the southern United States. For. Ecol. Manag. 2003, 186, 99–123. [Google Scholar] [CrossRef]
  9. Irland, L.C. Ice storms and forest impacts. Sci. Total Environ. 2000, 262, 231–242. [Google Scholar] [CrossRef]
  10. Lemon, P.C. Forest Ecology of Ice Storms. Bull. Torrey Bot. Club 1961, 88, 21–29. [Google Scholar] [CrossRef]
  11. Lugo, A.E. Visible and invisible effects of hurricanes on forest ecosystems: An international review. Austral. Ecol. 2008, 33, 368–398. [Google Scholar] [CrossRef]
  12. Beard, K.H.; Vogt, K.A.; Vogt, D.J.; Scatena, F.N.; Covich, A.P.; Sigurdardottir, R.; Siccama, T.G.; Crowl, T.A. Structural and functional responses of a subtropical forest to 10 years of hurricanes and droughts. Ecol. Monogr. 2005, 75, 345–361. [Google Scholar] [CrossRef] [Green Version]
  13. Boucher, D.H.; Vandermeer, J.H.; Yih, K.; Zamora, N. Contrasting Hurricane Damage in Tropical Rain Forest and Pine Forest. Ecology 1990, 71, 2022–2024. [Google Scholar] [CrossRef]
  14. Everham, E.M.; Brokaw, N.V.L. Forest damage and recovery from catastrophic wind. Bot. Rev. 1996, 62, 113–185. [Google Scholar] [CrossRef]
  15. Cannon, J.B.; Peterson, C.J.; O’Brien, J.J.; Brewer, J.S. A review and classification of interactions between forest disturbance from wind and fire. For. Ecol. Manag. 2017, 406, 381–390. [Google Scholar] [CrossRef]
  16. Gardiner, B.; Byrne, K.; Hale, S.; Kamimura, K.; Mitchell, S.J.; Peltola, H.; Ruel, J.-C. A review of mechanistic modelling of wind damage risk to forests. For. Int. J. For. Res. 2008, 81, 447–463. [Google Scholar] [CrossRef] [Green Version]
  17. Corfidi, S.F.; Coniglio, M.C.; Cohen, A.E.; Mead, C.M. A Proposed Revision to the Definition of “Derecho”. Bull. Am. Meteorol. Soc. 2016, 97, 935–949. [Google Scholar] [CrossRef]
  18. Guastini, C.T.; Bosart, L.F. Analysis of a progressive derecho climatology and associated formation environments. Mon. Weather Rev. 2016, 144, 1363–1382. [Google Scholar] [CrossRef]
  19. Vaughn, D.H. Derecho! The forgotten windstorm that changed the Ozarks. For. Hist. Today 2013, 2013, 4–12. [Google Scholar]
  20. Moser, W.K.; Hansen, M.H.; Nelson, M.D.; Crocker, S.J.; Perry, C.H.; Schulz, B.; Woodall, C.W.; Nagel, L.; Mielke, M.E. After the Blowdown: A Resource Assessment of the Boundary Waters Canoe Area Wilderness, 1999–2003; U.S. Department of Agriculture, Forest Service, Northern Research Station: Newtown Square, PA, USA, 2007; p. 54.
  21. Rich, R.L. Large Wind Disturbance in the Boundary Waters Canoe Area Wilderness: Forest Dynamics and Development Changes Associated with the 4 July 1999 Blowdown. Ph.D. Thesis, University of Minnesota, St. Paul, MN, USA, 2005. [Google Scholar]
  22. Hansen, M.C.; Stehman, S.V.; Potapov, P.T. Quantification of global gross forest cover loss. Proc. Natl. Acad. Sci. USA 2010, 107, 8650–8655. [Google Scholar] [CrossRef] [PubMed] [Green Version]
  23. Schleeweis, K.; Moisen, G.; Schroeder, T.; Toney, C.; Freeman, E.; Goward, S.; Huang, C.; Dungan, J. US National Maps Attributing Forest Change: 1986–2010. Forests 2020, 11, 653. [Google Scholar] [CrossRef]
  24. Schleeweis, K.; Goward, S.N.; Huang, C.; Masek, J.G.; Moisen, G.; Kennedy, R.E.; Thomas, N.E. Regional dynamics of forest canopy change and underlying causal processes in the contiguous U.S. J. Geophys. Res. Biogeosci. 2013, 118, 1035–1053. [Google Scholar] [CrossRef]
  25. Baumann, M.; Ozdogan, M.; Wolter, P.T.; Krylov, A.; Vladimirova, N.; Radeloff, V.C. Landsat remote sensing of forest windfall disturbance. Remote Sens. Environ. 2014, 143, 171–179. [Google Scholar] [CrossRef]
  26. Coulston, J.W.; Edgar, C.B.; Westfall, J.A.; Taylor, M.E. Estimation of forest disturbance from retrospective observations in a broad-scale inventory. Forests 2020, 11, 1298. [Google Scholar] [CrossRef]
  27. Staudhammer, C.; Escobedo, F.; Lawrence, A.; Duryea, M.; Smith, P.; Merritt, M. Rapid assessment of change and hurricane impacts to Houston’s urban forest structure. Arboric. Urban. For. 2011, 37, 60–66. [Google Scholar]
  28. Glass, P.A.; Oswalt, S.N. Initial Estimates of Hurricane Katrina Impacts of Mississippi Gulf Coast Forest Resources; Mississippi Institute for Forest Inventory: Jackson, MI, USA, 2007; pp. 1–4.
  29. Tetrault, R. Rapid Damage Assessment using FAS’s Global Agricultural and Disaster Assessment System—GADAS. In Proceedings of the 2019 Agricultural Outlook Forum (AOF)—Growing Locally, Selling Globally, Arlington, VA, USA, 21 February 2019. [Google Scholar]
  30. FAO. Rapid Damage Assessment to the Agriculture and Fisheries Sectors Report: Severe Tropical Cyclone Ian January 2014; Food and Agriculture Organisation of the United Nations Subregional Office for the Pacific Islands: Rome, Italy, 2014. [Google Scholar]
  31. Miller, J.D.; Knapp, E.E.; Key, C.H.; Skinner, C.N.; Isbell, C.J.; Creasy, R.M.; Sherlock, J.W. Calibration and validation of the relative differenced Normalized Burn Ratio (RdNBR) to three measures of fire severity in the Sierra Nevada and Klamath Mountains, California, USA. Remote Sens. Environ. 2009, 113, 645–656. [Google Scholar] [CrossRef]
  32. Norman, S.P.; Hargrove, W.W.; Spruce, J.P.; Christie, W.M.; Schroeder, S.W. Highlights of Satellite-Based Forest Change Recognition and Tracking Using the ForWarn System; Gen. Tech. Rep. SRS-GTR-180; USDA-Forest Service, Southern Research Station: Asheville, NC, USA, 2013; pp. 1–30.
  33. Rich, R.L.; Frelich, L.; Reich, P.B.; Bauer, M.E. Detecting wind disturbance severity and canopy heterogeneity in boreal forest by coupling high-spatial resolution satellite imagery and field data. Remote Sens. Environ. 2010, 114, 299–308. [Google Scholar] [CrossRef]
  34. Olofsson, P.; Foody, G.M.; Herold, M.; Stehman, S.V.; Woodcock, C.E.; Wulder, M.A. Good practices for estimating area and assessing accuracy of land change. Remote Sens. Environ. 2014, 148, 42–57. [Google Scholar] [CrossRef]
  35. Omernik, J.M.; Griffith, G.E. Ecoregions of the Conterminous United States: Evolution of a Hierarchical Spatial Framework. Environ. Manag. 2014, 54, 1249–1266. [Google Scholar] [CrossRef] [PubMed]
  36. Johnson, E.W.; Wittwer, D. Aerial detection surveys in the United States. Aust. For. 2008, 71, 212–215. [Google Scholar] [CrossRef]
  37. U.S. Department of Agriculture Forest Service. Forest Inventory and Analysis National Core Field Guide, Volume 1: Field Data Collection Procedures for Phase 2 Plots, Version 7.1; Northern Research Station Edition; U.S. Department of Agriculture, Forest Service, Northern Research Station: St. Paul, MN, USA, 2017; p. 407.
  38. Reams, G.; Smith, W.; Hansen, M.; Bechtold, W.; Roesch, F.; Moisen, G. The enhanced forest inventory and analysis program—National sampling design and estimation procedures. In The Forest Inventory and Analysis Sampling Frame, GTR SRS-80; U.S. Department of Agriculture, Forest Service: Asheville, NC, USA, 2005; pp. 21–36. [Google Scholar]
  39. Bechtold, W.A.; Patterson, P.L. (Eds.) The Enhanced Forest Inventory and Analysis Program—National Sampling Design and Estimation Procedures, GTR-SRS-80; U.S. Department of Agriculture, Forest Service, Southern Research Station: Asheville, NC, USA, 2005.
  40. Scott, C.T.; Bechtold, W.A.; Reams, G.A.; Smith, W.D.; Westfall, J.A.; Hansen, M.H.; Moisen, G.G. Sample-based estimators used by the Forest Inventory and Analysis National Information Management System. In The Enhanced Forest Inventory and Analysis Program—National Sampling Design and Estimation Procedures; Bechtold, W.A., Patterson, P.L., Eds.; U.S. Department of Agriculture Forest Service: Asheville, NC, USA, 2005; pp. 43–67. [Google Scholar]
  41. Suvanto, S.; Peltoniemi, M.; Tuominen, S.; Strandström, M.; Lehtonen, A. High-resolution mapping of forest vulnerability to wind for disturbance-aware forestry. For. Ecol. Manag. 2019, 453, 117619. [Google Scholar] [CrossRef]
  42. Randolph, K.C. Benefits and Limitations of Using Standard Forest Inventory and Analysis Data to Describe the Extent of a Catastrophic Weather Event. E-Res. Pap. SRS-55; Department of Agriculture Forest Service, Southern Research Station: Asheville, NC, USA, 2015; 10p.
  43. Liknes, G.C.; Crocker, S.J.; Morin, R.S.; Walters, B.F. Hurricane impacts on forest resources in the Eastern United States: A post-sandy assessment. In Pushing Boundaries: New Directions in Inventory Techniques and Applications, Proceedings of the Forest Inventory and Analysis (FIA) Symposium 2015, Portland, OR, USA, 10–12 December 2015; USDA, Forest Service, Pacific Northwest Research Station: Portland, OR, USA, 2015; pp. 173–177. [Google Scholar]
  44. Rao, J.N.K.; Molina, I. Small Area Estimation; John Wiley & Sons, Inc.: Hoboken, NJ, USA, 2015; 441p. [Google Scholar]
  45. Hale, S.E.; Gardiner, B.A.; Wellpott, A.; Nicoll, B.C.; Achim, A. Wind loading of trees: Influence of tree size and competition. Eur. J. For. Res. 2012, 131, 203–217. [Google Scholar] [CrossRef]
  46. Suvanto, S.; Henttonen, H.M.; Nöjd, P.; Mäkinen, H. Forest susceptibility to storm damage is affected by similar factors regardless of storm type: Comparison of thunder storms and autumn extra-tropical cyclones in Finland. For. Ecol. Manag. 2016, 381, 17–28. [Google Scholar] [CrossRef]
  47. Beach, R.H.; Sills, E.O.; Liu, T.-M.; Pattanayak, S. The influence of forest management on vulnerability of forests to severe weather. In Advances in Threat Assessment and Their Application to Forest and Rangeland Management; Pye, J.M., Rauscher, H.M., Sands, Y., Lee, D.C., Beatty, J.S., Eds.; U.S. Department of Agriculture, Forest Service, Pacific Northwest and Southern Research Stations: Portland, OR, USA, 2010; pp. 185–206. [Google Scholar]
  48. Stueve, K.M.; Perry, C.H.; Nelson, M.D.; Healey, S.P.; Hill, A.D.; Moisen, G.G.; Cohen, W.B.; Gormanson, D.D.; Huang, C. Ecological importance of intermediate windstorms rivals large, infrequent disturbances in the northern Great Lakes. Ecosphere 2011, 2, 1–21. [Google Scholar] [CrossRef]
  49. Jacobs, D.M. Forest inventory, catastrophic events and historic geospatial assessments in the south. In Proceedings of the ASPRS 2007 Annual Conference, Tampa, FL, USA, 7–11 May 2007. [Google Scholar]
  50. Morin, R.S.; Pugh, S.A.; Steinman, J. Mapping the Occurrence of Tree Damage in the Forests of the Northern United States; U.S. Department of Agriculture, Forest Service, Northern Research Station: Newtown Square, PA, USA, 2016; p. 19.
  51. Randolph, K.C.; Dooley, K.; Shaw, J.D.; Morin, R.S.; Asaro, C.; Palmer, M.M. Past and present individual-tree damage assessments of the US national forest inventory. Environ. Monit. Assess. 2021, 193, 116. [Google Scholar] [CrossRef] [PubMed]
  52. Masek, J.G.; Goward, S.N.; Kennedy, R.E.; Cohen, W.B.; Moisen, G.G.; Schleeweis, K.; Huang, C. United States forest disturbance trends observed using Landsat Time Series. Ecosystems 2013, 16, 1087–1104. [Google Scholar] [CrossRef] [Green Version]
  53. McRoberts, R.E. Post-classification approaches to estimating change in forest area using remotely sensed auxiliary data. Remote Sens. Environ. 2014, 151, 149–156. [Google Scholar] [CrossRef]
  54. Shimada, M.; Itoh, T.; Motooka, T.; Watanabe, M.; Shiraishi, T.; Thapa, R.; Lucas, R. New global forest/non-forest maps from ALOS PALSAR data (2007–2010). Remote Sens. Environ. 2014, 155, 13–31. [Google Scholar] [CrossRef]
Figure 1. Estimated peak wind gusts of the Midwest Derecho, 10–11 August 2020, Iowa, USA. Data source: NOAA Storm Prediction Center.
Forests 12 00555 g001
Figure 2. Iowa Derecho Damage Survey (IDDS) polygons within a 19-county area impacted by the 2020 Midwest Derecho (top left); NLCD2016 tree canopy cover in Iowa (bottom left); and FIA forest plots within a 221-county region, Iowa and adjacent states, USA (right). Plots were measured during 2013–2019 and depicted FIA plot locations are approximate.
Forests 12 00555 g002
Figure 3. Flowchart overview of methodology.
Forests 12 00555 g003
Table 1. Number of live, mortality, and removal trees (≥12.7 cm/5 in d.b.h.) on wind-disturbed forest land, by tree status/damage/breakage category, 2013–2019, in 221 counties within 200 km of IDDS counties, USA. Sampling errors represent ± 1 standard error (SE).
Tree StatusTree Damage LocationTrees in Wind-Disturbed ConditionsTrees with Wind Damage (Live) or Weather Agent (Mortality and Removals)SE (Percent)SE (Trees)Percent of Trees
LiveBranch7,564,768840,66338.18320,96511.11
LiveStem7,564,768653,68051.59282,353 7.23
LiveTotal 1,494,34438.71537,28118.35
Mortality/RemovalN/A11,027,6382,809,46038.691,086,99425.48
Total 1 4,303,80327.831,168,03243.82
1 No total is reported for trees in wind disturbed conditions because mortality and removals are relative to live trees at time 1, damage is relative to trees still alive at time 2.
Table 2. Regional sound bole volume (m3) of live, mortality, and removal trees (≥12.7 cm/5 in d.b.h.) on wind-disturbed forest land, by tree status/damage/breakage category, 2013–2019, in 221 counties within 200 km of IDDS counties, USA. Sampling errors represent ± 1 standard error (SE).
Tree StatusTree Damage LocationVolume in Wind-Disturbed ConditionsVolume with Wind Damage (Live) Or Weather Agent (Mortality and Removals)SE (Percent)SE (Volume)Percent of Volume
LiveBranch3,856,448 549,20145.51249,94114.24
LiveStem3,856,448456,25359.43244,15010.65
LiveTotal 1,005,45437.70361,92824.89
Mortality/RemovalN/A4,927,3701,416,61529.31415,19528.75
Total 1 2,422,06922.83542,64853.64
1 No total is reported for trees in wind disturbed conditions because mortality and removals are relative to live trees at time 1, damage is relative to trees still alive at time 2.
Table 3. Pre-storm and damage estimates in number and volume of trees (≥12.7 cm/5 in d.b.h.) on forest land affected by the August 2020 Midwest Derecho, Iowa, USA. Sampling errors represent ± 1 SE.
Pre-Storm (2019) Estimates for Affected AreaEstimateSE %SE Estimate
Area of forest land (ha)23,07130.266981
Number of live trees 5,901,19633.091,952,706
Sound bole volume (m3) of live trees 3,034,66933.061,003,262
Damage estimates number of trees on forest landEstimate
Trees with branch damage655,792
Trees with stem damage509,929
Total trees with damage1,165,722
Trees mortality/removals1,503,420
Total number of trees mortality and damage2,669,142
Damage estimate sound bole volume (m3) of live trees on forest landEstimate
Volume with branch damage432,170
Volume with stem damage359,029
Total volume with damage791,199
Volume of mortality/removals872,465
Total sound bole volume for damaged trees, mortality, and removals1,663,664
Table 4. Aerial survey severity categories and pre-storm and damage estimates in number of trees (≥12.7 cm/5 in d.b.h.) on forest land affected by the August 2020 Midwest Derecho, Iowa, USA.
Severity CategoryNumber of Live TreesMidpoint (%)Number of Damaged Trees
Moderate (11–29%)1,175,42120235,084
Severe (30–50%)4,073,732401,629,493
Very Severe (>50%)652,04475489,033
Total5,901,197 2,353,610
Publisher’s Note: MDPI stays neutral with regard to jurisdictional claims in published maps and institutional affiliations.

