Editor’s note
The following abstract describes a publication that is only available as a downloadable PDF.
Summary
The U.S. Census of Aquaculture estimated $1.5 billion in total sales accrued nationally to producers in 2018. Of all aquaculture sales, 47% originated from food fish sales. Following food fish were mollusks at 29% of all sales, miscellaneous aquaculture at 9%, crustaceans at 7%, sport fish and ornamentals at 3% each and bait fish at 2%. Missouri captured 1% of all U.S. aquaculture sales, according to the 2018 U.S. Census of Aquaculture. Missouri’s industry exhibited 3% sales growth in nominal dollars from 2013 to 2018, but the growth did not keep up with inflation. Missouri generated 3% of all U.S. bait fish sales. In no other aquaculture category did the state achieve a market share this high. However, food fish more heavily contributed to the state’s aquaculture sales — 66% of all sales; see Exhibit S.1. Food fish also saw the strongest growth in Missouri sales from 2013 to 2018; their sales increased by 36%.
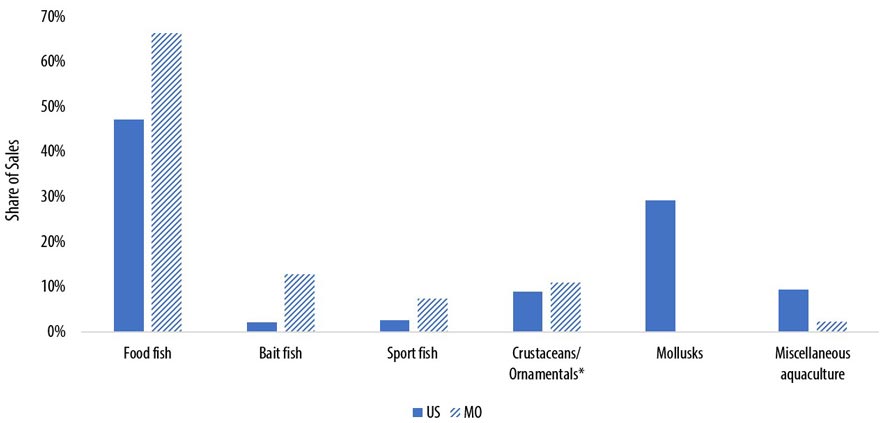
Source: 2018 Census of Aquaculture, USDA National Agricultural Statistics Service
Exhibit S.1. Share of 2018 Aquaculture Producer Sales by Category.
Food Fish
The Missouri aquaculture producer survey conducted for this project found that 43% of responding Missouri aquaculture producers — nine of them — sold fish through food markets and 10%, or two producers, sold crustaceans through food markets. Producers serving food markets have an opportunity to reach consumers who increasingly have added more seafood to their diets. NOAA Fisheries indicates per capita fishery products consumption increased from roughly 15 pounds per capita in the early 1990s to 19 pounds per capita in 2020. Fresh and frozen consumption drove the growth. Canned seafood consumption largely followed a downward trend. Recently, however, “tinned fish” has had interest from younger consumers and garnered social media buzz, and this momentum has led to some canned seafood product introductions with premium positioning and price points.
In terms of seafood consumption by species, shrimp was the top choice in 2020 at 5 pounds per capita. Salmon and canned tuna ranked second and third, respectively, for per capita consumption. Conducted in fall 2020 by the North Central Regional Aquaculture Center, a nationally representative survey found consumers had interest in buying rainbow trout, lake trout, Great Lakes whitefish, Pacific salmon, bass and Atlantic salmon if they were available.
Spending on fish and seafood averaged $121 per consumer unit — a family or group living together — in 2011, but it increased to $178 on average by 2021, according to Consumer Expenditure Surveys data from the U.S. Bureau of Labor Statistics. The following demographic characteristics were positively associated with greater fish and seafood expenditures: middle-aged, Asian, higher income and larger households. Those living in rural areas and the Midwest tended to report lower fish and seafood expenditures. In its Power of Seafood 2023 report, FMI–The Food Industry Association published sales data collected by IRI for multioutlet retailers, which include food stores, drug stores, mass retailers, Walmart, club stores other than Costco, dollar stores and military stores. In 2022, frozen seafood sales totaled $7.1 billion, and fresh sales reached $6.5 billion. The grocery department recorded $2.7 billion in seafood sales. Frozen sales did well during the pandemic because these products store well and have an economical price point. Post-pandemic, frozen sales may normalize.
Factors motivating seafood consumption include taste, healthfulness and price. Some consumers also exhibit preferences for the seafood production or sourcing model used. Of the seafood consumers FMI–The Food Industry Association surveyed for its Power of Seafood 2023 research, 34% preferred wild-caught seafood, and 10% would only buy or eat wild-caught. Three in 10 had no preference, and 20% said they either preferred farm-raised or would only buy or eat farm-raised options. Responding consumers had relatively low understanding of “aquaculture” and “indoor farm-raised” terms relative to understanding of “wild-caught” and “farm-raised.” Therefore, consumer education may be needed. U.S. seafood processors have been most likely to handle Alaska pollock, salmon and shrimp, and these processors commonly add value through preparing dressed, canned and filleted goods, according to processor data from NOAA Fisheries. Other opportunities to add value to fishery products include smoking fish, packaging seafood in platters or preparing seafood salads and other ready-to-eat foods. Short-staffed food service businesses may appreciate precut or preportioned products.
To sell seafood products, U.S. aquaculture producers rely on processors as buyers; 70% of food fish sales had processors as the first point of sale in 2018, according to Census of Aquaculture data. Live haulers or brokers and wholesale to other producers ranked second and third, respectively, in terms of points of first food fish sale for aquaculture producers. Producers interested in selling seafood products may consider reaching grocery stores, fish markets, restaurants or direct-to-consumer channels.
Seafood consumers have been slightly more likely to source seafood from market channels consistent with at-home consumption than away-from-home consumption, according to a 2020 article from Nutrients that detailed National Health and Nutrition Examination Survey data. Recently, retailers have stocked fewer seafood products — possibly due to supply chain issues or higher prices than consumers may be willing to pay. Retailers consider factors such as consumer preferences, price and freshness when making stocking decisions. To promote seafood goods, producers may consider timing promotions to seasons, such as the Chinese Lunar New Year and the winter holidays, when consumers often buy more seafood.
Bait Fish
Nationally, bait fish sales from aquaculture producers were $32.8 million in 2018 and increased 11% in nominal dollars from 2013 — a 2% decline after adjusting for inflation. U.S. production is relatively concentrated. Arkansas contributed two-thirds of total bait fish sales in 2018. Missouri producers generated 3% of U.S. sales. Missouri is not known to ship live bait in-region to other states, according to a 2019 analysis conducted for the Mississippi River Basin Panel on Aquatic Nuisance Species.
Bait fish are sold for both recreational and commercial fishing purposes and as feeder fish for aquariums, zoos, private pond owners and wildlife management agencies. In 2018, 38% of all national first-point sales went to live haulers and brokers, 19% went to businesses that stock recreational ponds, 17% went wholesale to other aquaculture producers and 15% went to retail outlets. The remaining 11% went directly to consumers, exports, government agencies or other buyers. In the U.S. bait fish marketplace, an estimated 40% to 50% of bait fish sold are wild-caught. Expenditures on live, cut and prepared bait were $1.5 billion in 2020, and artificial bait sales were $1.1 billion. Almost two-thirds of anglers use live bait, according to a 2020 national study by Southwick Associates. This study signaled potential concern about the future of the recreational fishing industry and bait market as fewer young people fish and more fishers choose artificial bait. Challenges also include fewer bait distributors in the northern Mississippi River basin and more convenience stores offering bait, which may lower customer service and satisfaction.
A few species dominate the bait fish market. They include golden shiners, fathead minnows and goldfish. These species also averaged the highest price per pound in the 2018 USDA Census of Aquaculture. Serious anglers may seek out specific species to attract their desired fish. Prices can vary widely depending on how bait is packaged and sold. Bait fish producers must meet specific size specifications to achieve different retail grades, and consistent delivery schedules — sometimes as often as twice a week — are important. To distribute product, bait fish producers may use 5-gallon buckets or fill a certain number of aerated compartments on a live hauler truck. Missouri-based bait dealers must register with the Missouri Department of Conservation, and the 153 registered businesses, as of April 2023, cluster in the Ozarks, mid-Missouri and St. Louis region. Very few producers add value to bait fish through processing.
Sport Fish
Missouri has a small share of a consolidating but growing U.S. sport fish industry. According to Census of Aquaculture data, the number of U.S. farms with sport fish sales declined slightly between 2013 and 2018. During this same period, total sport fish sales increased 51% after adjusting for inflation to an estimated $39.3 million. At the time of the 2018 census, Missouri represented 3% of all sport fish farms and 1.5% of total U.S. sales. A 2021 report from the American Sportfishing Association found the state represented 2.2% of U.S. freshwater retail sport fishing sales. Sport fishing economic activity geographically concentrates in states with major waterbodies; examples include Texas, Florida, California, Michigan and Minnesota, according to the association’s report. Sixteen (80%) of Missouri producers responding to this project’s accompanying needs assessment survey said they sold fish for pond or sport stocking in 2022 — the most common product category.
Bass, specifically largemouth bass, dominate U.S. sport fish sales by total sales volume and number of producers as they are favored species among anglers. Trout, sunfish and catfish are also important species by number of farms and sales. Producers sell sport fish through multiple market channels; 54% of all fish were sold through recreational stocking or live haulers or brokers in 2018. Another 20% went to exports, and 14% were sold to retail outlets. Producers may offer delivery services to expand reach to customers.
An estimated 17% of the U.S. population fishes in an average year. Two-thirds of anglers fished 11 times or fewer in 2021, and half of these individuals fished three times or less, according to a national study from the Outdoor Foundation and Recreational Boating and Fishing Foundation. Freshwater fishing was preferred among respondents, and more than half expressed an interest to fish more often or start fishing.
Aquaculture producers can add sport fishing-related revenue streams by considering a farm’s suitability for offering on-site fee-fishing experiences, which could be expanded to include guide services, lodging and other direct sales. Producers targeting pond stocking may think creatively about packaging products on a whole-pond basis, offering species bundles to appeal to a type of angler or supplementing fish sales with management recommendations or other services that establish a multiseason touchpoint with customers.
Ornamental Fish
A 2023–24 survey from the American Pet Products Association found an estimated 11.1 million U.S. households owned freshwater fish, and 2.2 million households owned saltwater fish. Within the broader U.S. pet industry, ornamental fish were a small niche. Based on the 2023–24 survey data, 12.8% of all pet owner households owned freshwater fish, and 2.5% of pet owner households had saltwater fish. Beyond identifying consumer preferences for freshwater fish, a lack of detailed species data exist.
Compared with other segments of the aquaculture industry, less information describes the size and composition of the U.S.-produced ornamental fish market. The 2018 Census of Aquaculture estimated that $43.5 million in total ornamental fish sales accrued to producers, and nearly two-thirds of all sales were attributed to Florida producers. Notably, the U.S. was the largest ornamental fish importer in 2021. U.S. imports were valued at an estimated $74.9 million — nearly one-fifth of all ornamental fish imports. The top countries supplying imports to the U.S. were Singapore, Sri Lanka and the Philippines.
Consumer interest in ornamental fish ownership grew during the pandemic. An estimated 14% of respondents acquired a pet at the time, according to data from a 2021-22 survey from the American Pet Products Association. In 2022, some reports indicated unfilled orders and low stocks. Some consumers value novel species and colors. Knowing how to clean and maintain aquariums can concern fish owners. Given this information, producers may be able to add value to their ornamental fish sales by offering unique species or colors and providing fish care and maintenance guidance.
Producers in the ornamental fish market captured 33% of all 2018 sales directly from retailers, according to the Census of Aquaculture. Sales to live haulers and brokers and wholesale sales to other producers were other important distribution channels. In 2018, 15% of ornamental fish sales were made directly to consumers by U.S. aquaculture producers — a larger direct-to-consumer share than the shares observed in the food fish, bait fish or sport fish markets.
Contents
- Summary
- Food Fish and Seafood
- Missouri Aquaculture Landscape
- Seafood Consumption and Purchase Behavior
- Seafood Sales
- Marketing Considerations
- Bait Fish
- Missouri Aquaculture Landscape
- Sales Trends
- Marketing Considerations
- Sport Fish
- Missouri Aquaculture Landscape
- Sales Trends
- Marketing Considerations
- Ornamental Fish
- Sales Trends
- Marketing Considerations
Pages
- 121