Marine Vertebrate Biodiversity and Distribution Within the Central California Current Using Environmental DNA (eDNA) Metabarcoding and Ecosystem Surveys
 Collin J. Closek1,2*
  Jarrod A. Santora3
  Hilary A. Starks1,2
  Isaac D. Schroeder4,5
  Elizabeth A. Andruszkiewicz1
  Keith M. Sakuma6
  Steven J. Bograd5
  Elliott L. Hazen5,7 John C. Field6
  Alexandria B. Boehm1
- 1Department of Civil and Environmental Engineering, Stanford University, Stanford, CA, United States
- 2Stanford Center for Ocean Solutions, Stanford University, Stanford, CA, United States
- 3Department of Applied Mathematics and Statistics, Center for Stock Assessment Research, University of California, Santa Cruz, Santa Cruz, CA, United States
- 4Cooperative Institute for Marine Ecosystems and Climate, University of California, Santa Cruz, Santa Cruz, CA, United States
- 5Environmental Research Division, Southwest Fisheries Science Center, National Marine Fisheries Service, National Oceanic and Atmospheric Administration, Monterey, CA, United States
- 6Fisheries Ecology Division, Southwest Fisheries Science Center, National Marine Fisheries Service, National Oceanic and Atmospheric Administration, Santa Cruz, CA, United States
- 7Department of Ecology and Evolutionary Biology, University of California, Santa Cruz, Santa Cruz, CA, United States
Environmental DNA (eDNA) metabarcoding is a new approach for assessing marine biodiversity that may overcome challenges of traditional monitoring and complement both existing surveys and biodiversity assessments. There are limited eDNA studies that evaluate vertebrate biodiversity in the marine environment or compare patterns of biodiversity with traditional methods. This study uses eDNA metabarcoding of the mitochondrial 12S rRNA genes present in seawater samples to characterize vertebrate biodiversity and distribution within National Marine Sanctuaries located in the California Current upwelling ecosystem. The epipelagic community in the study region has been monitored using traditional (mid-water trawl and marine mammal) survey methods since 1983. During 2016 and 2017, we concurrently sampled the epipelagic community using traditional survey methods and water for eDNA analysis to assess agreement among the methods. We collected replicate eDNA samples from 25 stations at depths of 10, 40, and 80 m, resulting in 131 small volume (1 L) environmental water samples to examine eDNA sequences. Across the eDNA and traditional survey methods, 80 taxa were identified. Taxa identified by eDNA partially overlapped with taxa through trawl and marine mammal surveys, but more taxa were identified by eDNA. Diversity and distribution patterns of marine vertebrates inferred from eDNA sequences reflected known spatial distribution patterns in species occurrence and community structure (e.g., cross-shelf and alongshore patterns). During both years, we identified fishery taxa Sebastes (rockfish), Merluccius (hake), Citharichthys (sanddab), and Engraulis (anchovy) across the majority of the stations using eDNA metabarcoding. The marine vertebrate assemblage identified by eDNA in 2016 was statistically different from the 2017 assemblage and more marine mammals were identified in 2017 than in 2016. Differences in assemblages identified by eDNA were coincident with different oceanographic conditions (e.g., upwelling and stratification). In 2016, weak upwelling and warmer than average conditions were measured, and vertebrate assemblages were not different among ecological regions [Point Reyes, Pescadero, and Monterey Bay]. While in 2017, average upwelling conditions returned, vertebrate assemblages differed at each region. This study illustrates that eDNA provides a new baseline for vertebrate assessments that can both augment traditional biomonitoring surveys and aid our understanding of changes in biodiversity.
Introduction
Marine biodiversity is in decline globally in part due to overfishing, pollution, and climate change (Jackson et al., 2001; Pauly et al., 2002; Cheung et al., 2013; Barange et al., 2014; Haigh et al., 2015; McCauley et al., 2015; Somero et al., 2016). Due to the vastness and inaccessibility of the ocean, biodiversity patterns in pelagic ecosystems are difficult to assess (National Research Council, 1992; Kaschner et al., 2006). As a result, efforts to monitor and detect changes in biodiversity are limited. Effective conservation policies to protect biodiversity are critical to maintaining healthy and resilient ecosystems (Sciberras et al., 2013; Lubchenco and Grorud-Colvert, 2015; O’Leary et al., 2016), yet are challenging to implement. Future efforts to manage and conserve marine resources would benefit from the evaluation and application of new biological monitoring (biomonitoring) technologies to improve capabilities to monitor species abundance, diversity, and distribution patterns in marine ecosystems.
Traditional biomonitoring of pelagic vertebrate distributions includes use of net trawl surveys to assess mid-water and benthic organisms, and visual surveys to assess air-breathing vertebrates (e.g., marine mammals) (Barlow and Forney, 2007; Keller et al., 2012; Sakuma et al., 2016). Although fisheries-dependent data (e.g., catch per unit effort from fishing vessels) have been used to inform fish population models since the early 20th century, fishery independent monitoring (from trawl or visual surveys) of marine fish and mammals has only been common practice since about the 1960s (Gunderson, 1993). Around the same time, government-led assessments of targeted fisheries began along with the collection of landings data as stocks began to decline (Edwards et al., 2010).
Off the coast of the Western United States, the California Current Ecosystem (CCE) is a productive eastern boundary upwelling system that stretches from the Strait of Juan de Fuca to Baja California along the Washington, Oregon, and California coasts. The CCE has high seasonal primary productivity that contributes to marine biodiversity that is of both economic and conservation importance (Checkley and Barth, 2009; Fautin et al., 2010). Off central California, the National Oceanic and Atmospheric Administration (NOAA) National Marine Fisheries Service conducts an annual Rockfish Recruitment and Ecosystem Assessment Survey (RREAS) during peak springtime upwelling conditions. Since 1983, this annual survey of juvenile rockfish and other groundfish has used trawl and acoustic survey methods to monitor the distribution, abundance, and biodiversity of pelagic micronektonic organisms, and visual surveys (e.g., line transect) to monitor the abundance and distribution of seabirds and marine mammals (Santora et al., 2012, 2017; Ralston et al., 2015; Sakuma et al., 2016). The RREAS represents one of the longest-running time series of epipelagic juvenile fishes and other micronekton (referred to here on as “forage assemblages”) monitoring in the world (Edwards et al., 2010; McClatchie et al., 2014). Using data from the RREAS, researchers have assessed the environmental drivers of juvenile rockfish abundances, spatial ecology of forage assemblages and their relationships with seabird breeding performance and spatial distribution, as well as documented baseline patterns of pelagic biodiversity (Santora et al., 2012, 2014, 2017; Ralston et al., 2013; Schroeder et al., 2018). Stations from the RREAS adhere to regional zones, and long-term datasets have shown these regions to be ecologically important for particular species and distributions of those organisms can be spatially explicit to specific regions (Santora et al., 2012). The present study augments the RREAS by using environmental DNA (eDNA), the DNA shed by organisms into the environment, to biomonitor vertebrates concurrently.
eDNA can be isolated from water samples and analyzed to detect unique sequences from microorganisms to large vertebrates, thus allowing biodiversity assessments to be completed without visually observing organisms (Foote et al., 2012; Thomsen et al., 2012; Kelly et al., 2014; Djurhuus et al., 2017). eDNA has been used to indicate presence of invasive species (Pochon et al., 2013), assess changes in taxa assemblages over time (Sawaya et al., 2019), and track ecologically important marine species (Sassoubre et al., 2016). In the CCE, eDNA has been used to detect vertebrates in Monterey Bay (Port et al., 2016; Andruszkiewicz et al., 2017b) and off the coast of Santa Barbara (Lafferty et al., 2018). Other studies have compared marine vertebrate eDNA assessments to visual surveys (Thomsen et al., 2012, 2016; Port et al., 2016; Kelly et al., 2017; Yamamoto et al., 2017; Boussarie et al., 2018; Stat et al., 2019). While some of the aforementioned studies used DNA metabarcoding or quantitative polymerase chain reaction (qPCR) to investigate vertebrate biodiversity, our study expands on that body of work by examining eDNA metabarcoding of vertebrates in the CCE by comparing both concurrent net tows and marine mammal visual sightings to assess agreement among the methods.
This study compares oceanographic and biomonitoring data collected over two years within five geographic regions, spanning 539 km, including stations within the Cordell Bank, Gulf of the Farallones, and Monterey Bay National Marine Sanctuaries. We test hypotheses to examine whether vertebrate taxa identified as present through eDNA differ among the various regions and the two collection years. We compare oceanographic conditions within the two sampling years to correlate different environmental conditions with biodiversity patterns. eDNA biomonitoring data are compared to concurrently collected data on the distribution of epipelagic fish and marine mammals collected at the same stations and day to determine the level of taxa overlap between the three methods. We also discuss and compare eDNA results in relation to known pelagic biodiversity patterns and assess the utility of eDNA for monitoring the presence of difficult to survey marine vertebrates.
Materials and Methods
Oceanographic Condition Surveys and Field Biological Collections
Biological samples and environmental data were collected from the NOAA Fisheries Survey Vessel Reuben Lasker during the 2016 and 2017 RREAS (NOAA project numbers RL-16-03 and RL-17-03). The cruises took place during April and May in both years. Sample collection occurred over six days in 2016 and five days in 2017. Each day, stations were sampled within a given region representing a subset of the full RREAS stations within the Cordell Bank, Gulf of the Farallones, and Monterey Bay National Marine Sanctuaries off the coast of California, United States (Figures 1, 2; Sakuma et al., 2016). Concurrently, salinity and temperature were measured at each station using an SBE 9plus conductivity–temperature–depth (CTD) sensor (Sea-Bird Scientific, United States). Instrument casts were made to a depth of 500 m or to 10 m from the bottom in shallower locations, and measurements were obtained throughout the water column. To assess regional oceanographic conditions, we calculated the following at each station: depth-averaged mean sea temperature and salinity over 20–40 m (depth range chosen to match net haul depth), stratification strength as the integrated potential energy between 0 and 40 m (Ladd and Stabeno, 2012), and depth of the 26.0 isopycnal (Santora et al., 2014; Schroeder et al., 2014). The stratification strength and 26.0 isopycnal depth were calculated to assess vertical ocean conditions and to provide a relative index of upwelling conditions and nutricline depth. Further, to compare differences in oceanic conditions during 2016 and 2017 relative to past RREAS data, we calculated the spatial climatology of these variables over 1990–2017 (using April–May averages, Santora et al., 2014; Schroeder et al., 2014). These variables were spatially interpolated using the optimal interpolation scheme Divand1 with a 15-km meridional correlation length and a 10-km zonal length. The data were interpolated onto a grid having a 0.1° × 0.1° spacing, and the interpolation parameters were set to force the interpolations to match observations (Figure 2).
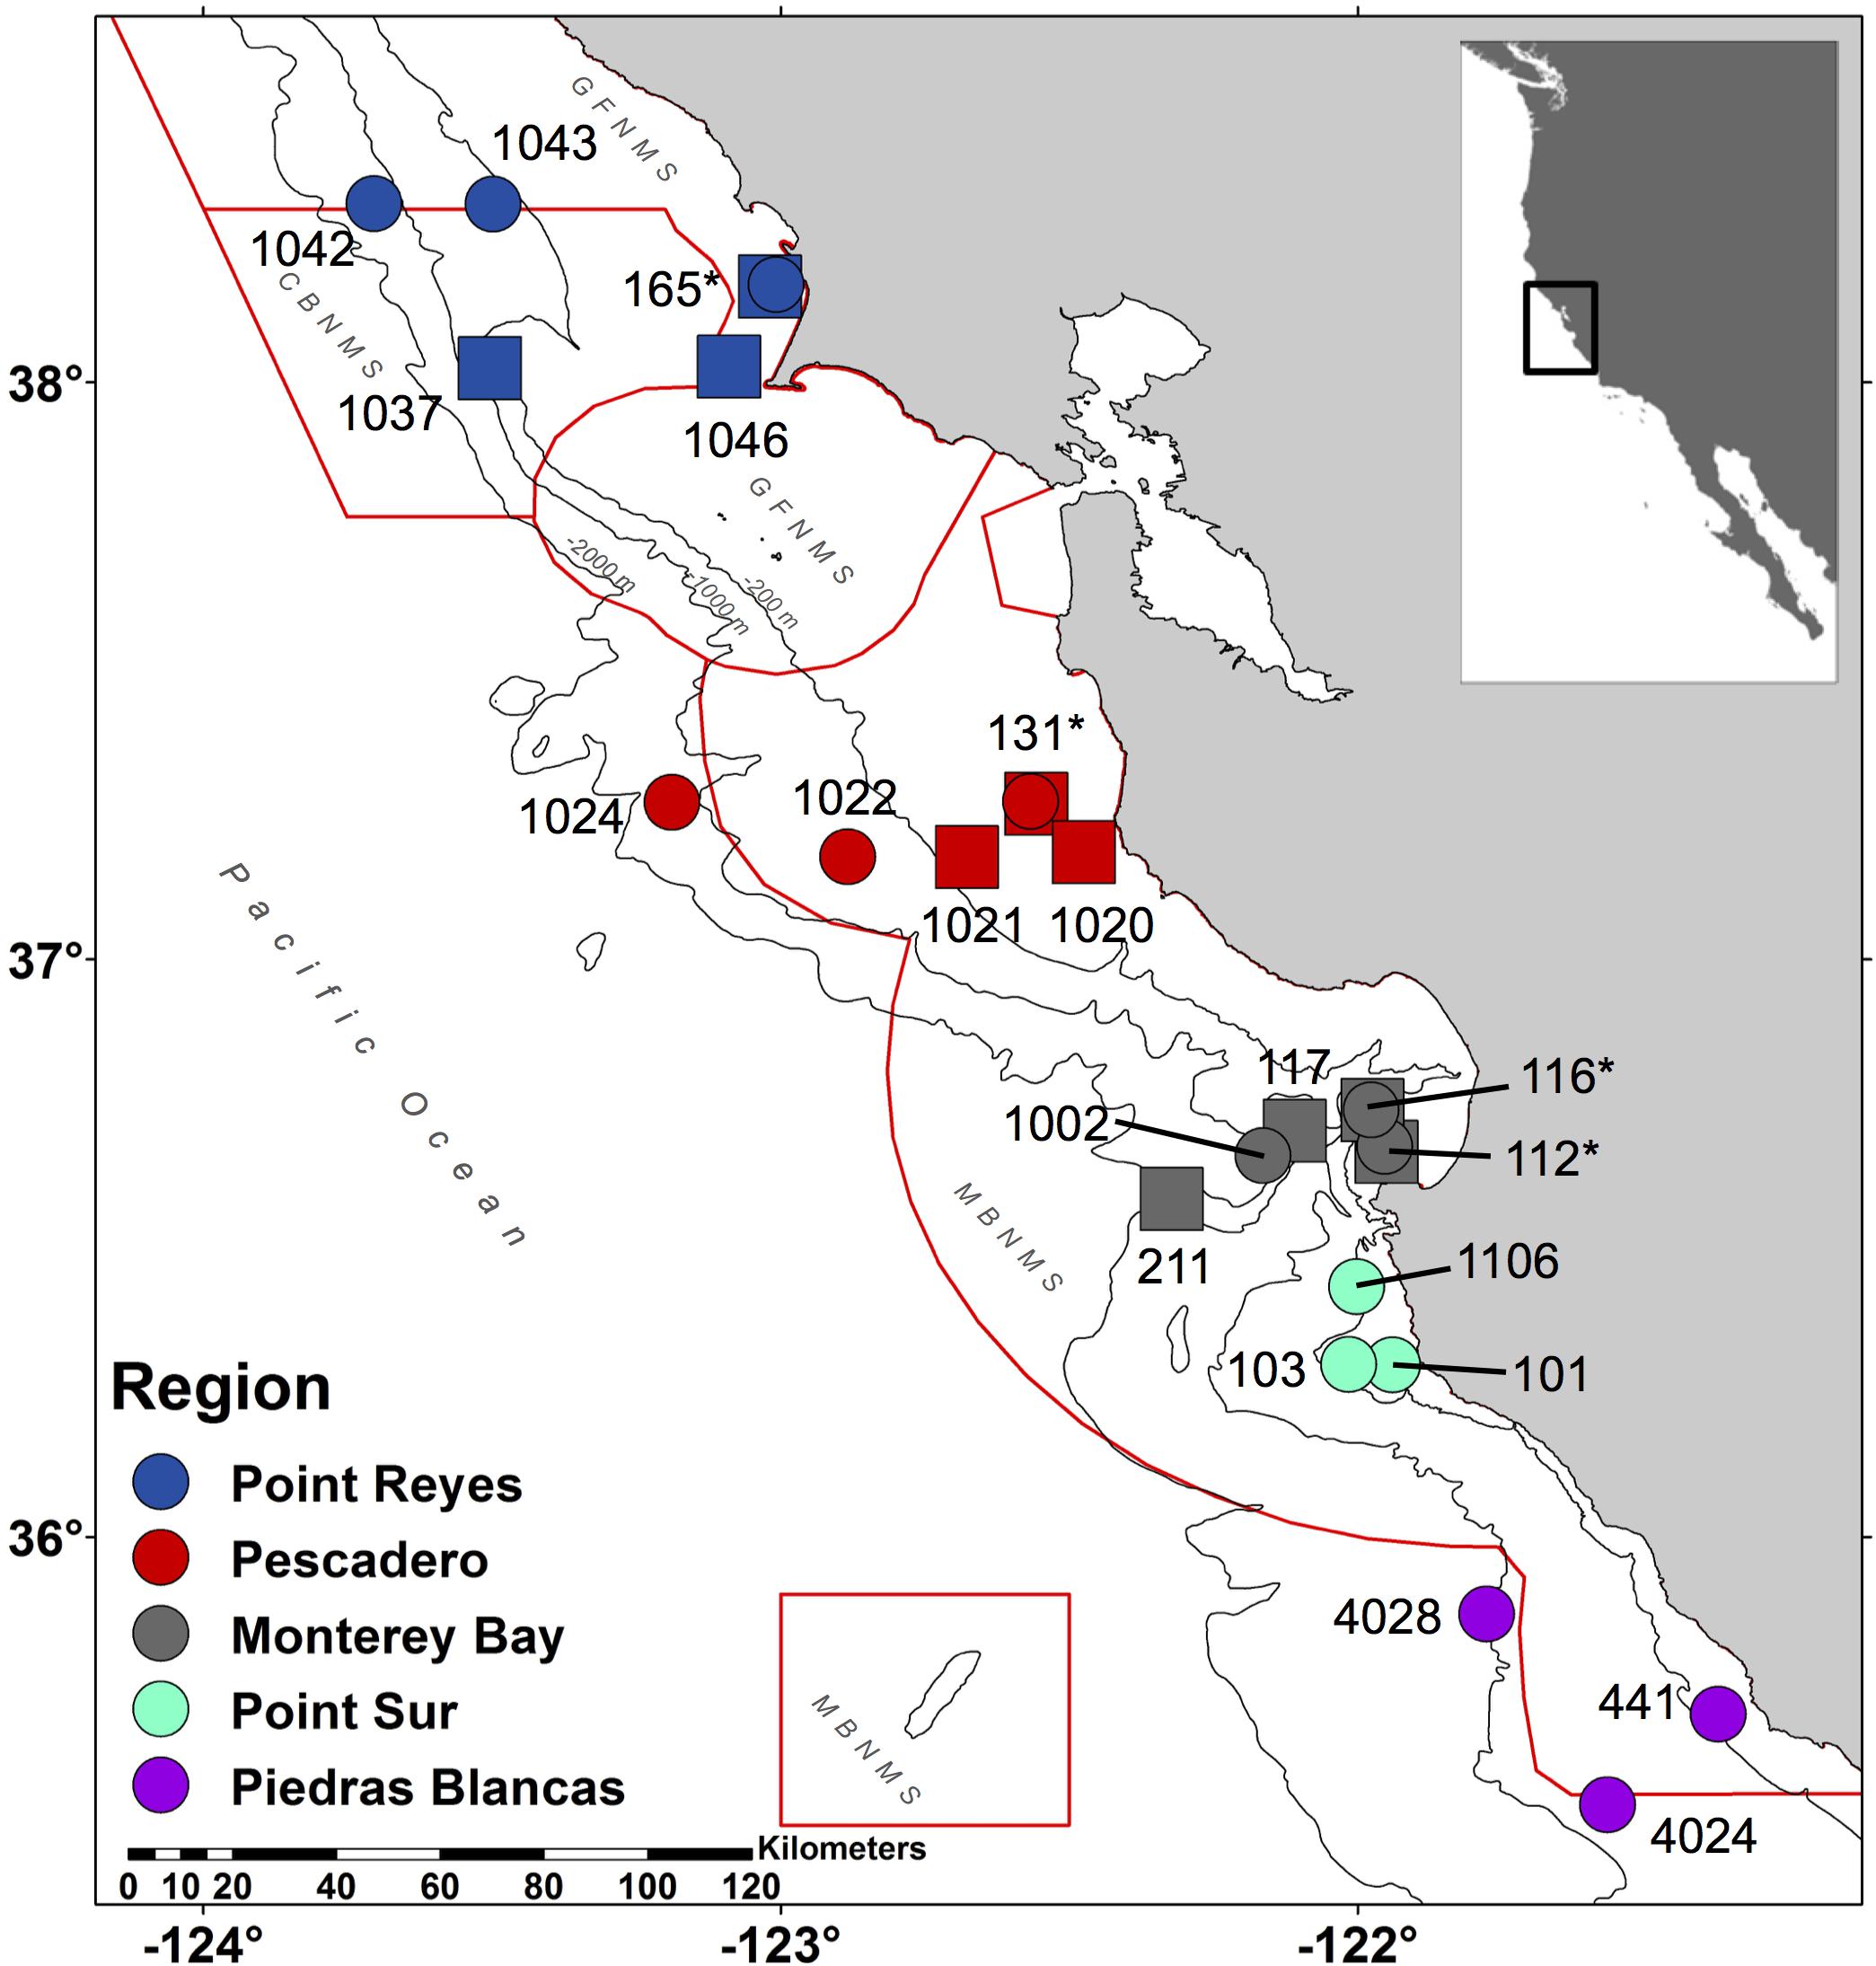
Figure 1. Central California eDNA sampling map. This map indicates the stations where seawater was collected during 2016 (circles) and 2017 (squares). Each location, from north to south, is indicated by a color: Point Reyes (blue), Pescadero (red), Monterey Bay (gray), Point Sur (turquoise), and Piedras Blancas (violet). National Marine Sanctuaries are outlined in red from north to south: Gulf of the Farallones (GFNMS), Cordell Bank (CBNMS), GFNMS again, and Monterey Bay (MBNMS) with an additional red box around Davidson Seamount, which is part of MBNMS. Contours are 200, 1000, and 2000 m isobaths. Stations that were collected both years = ∗.
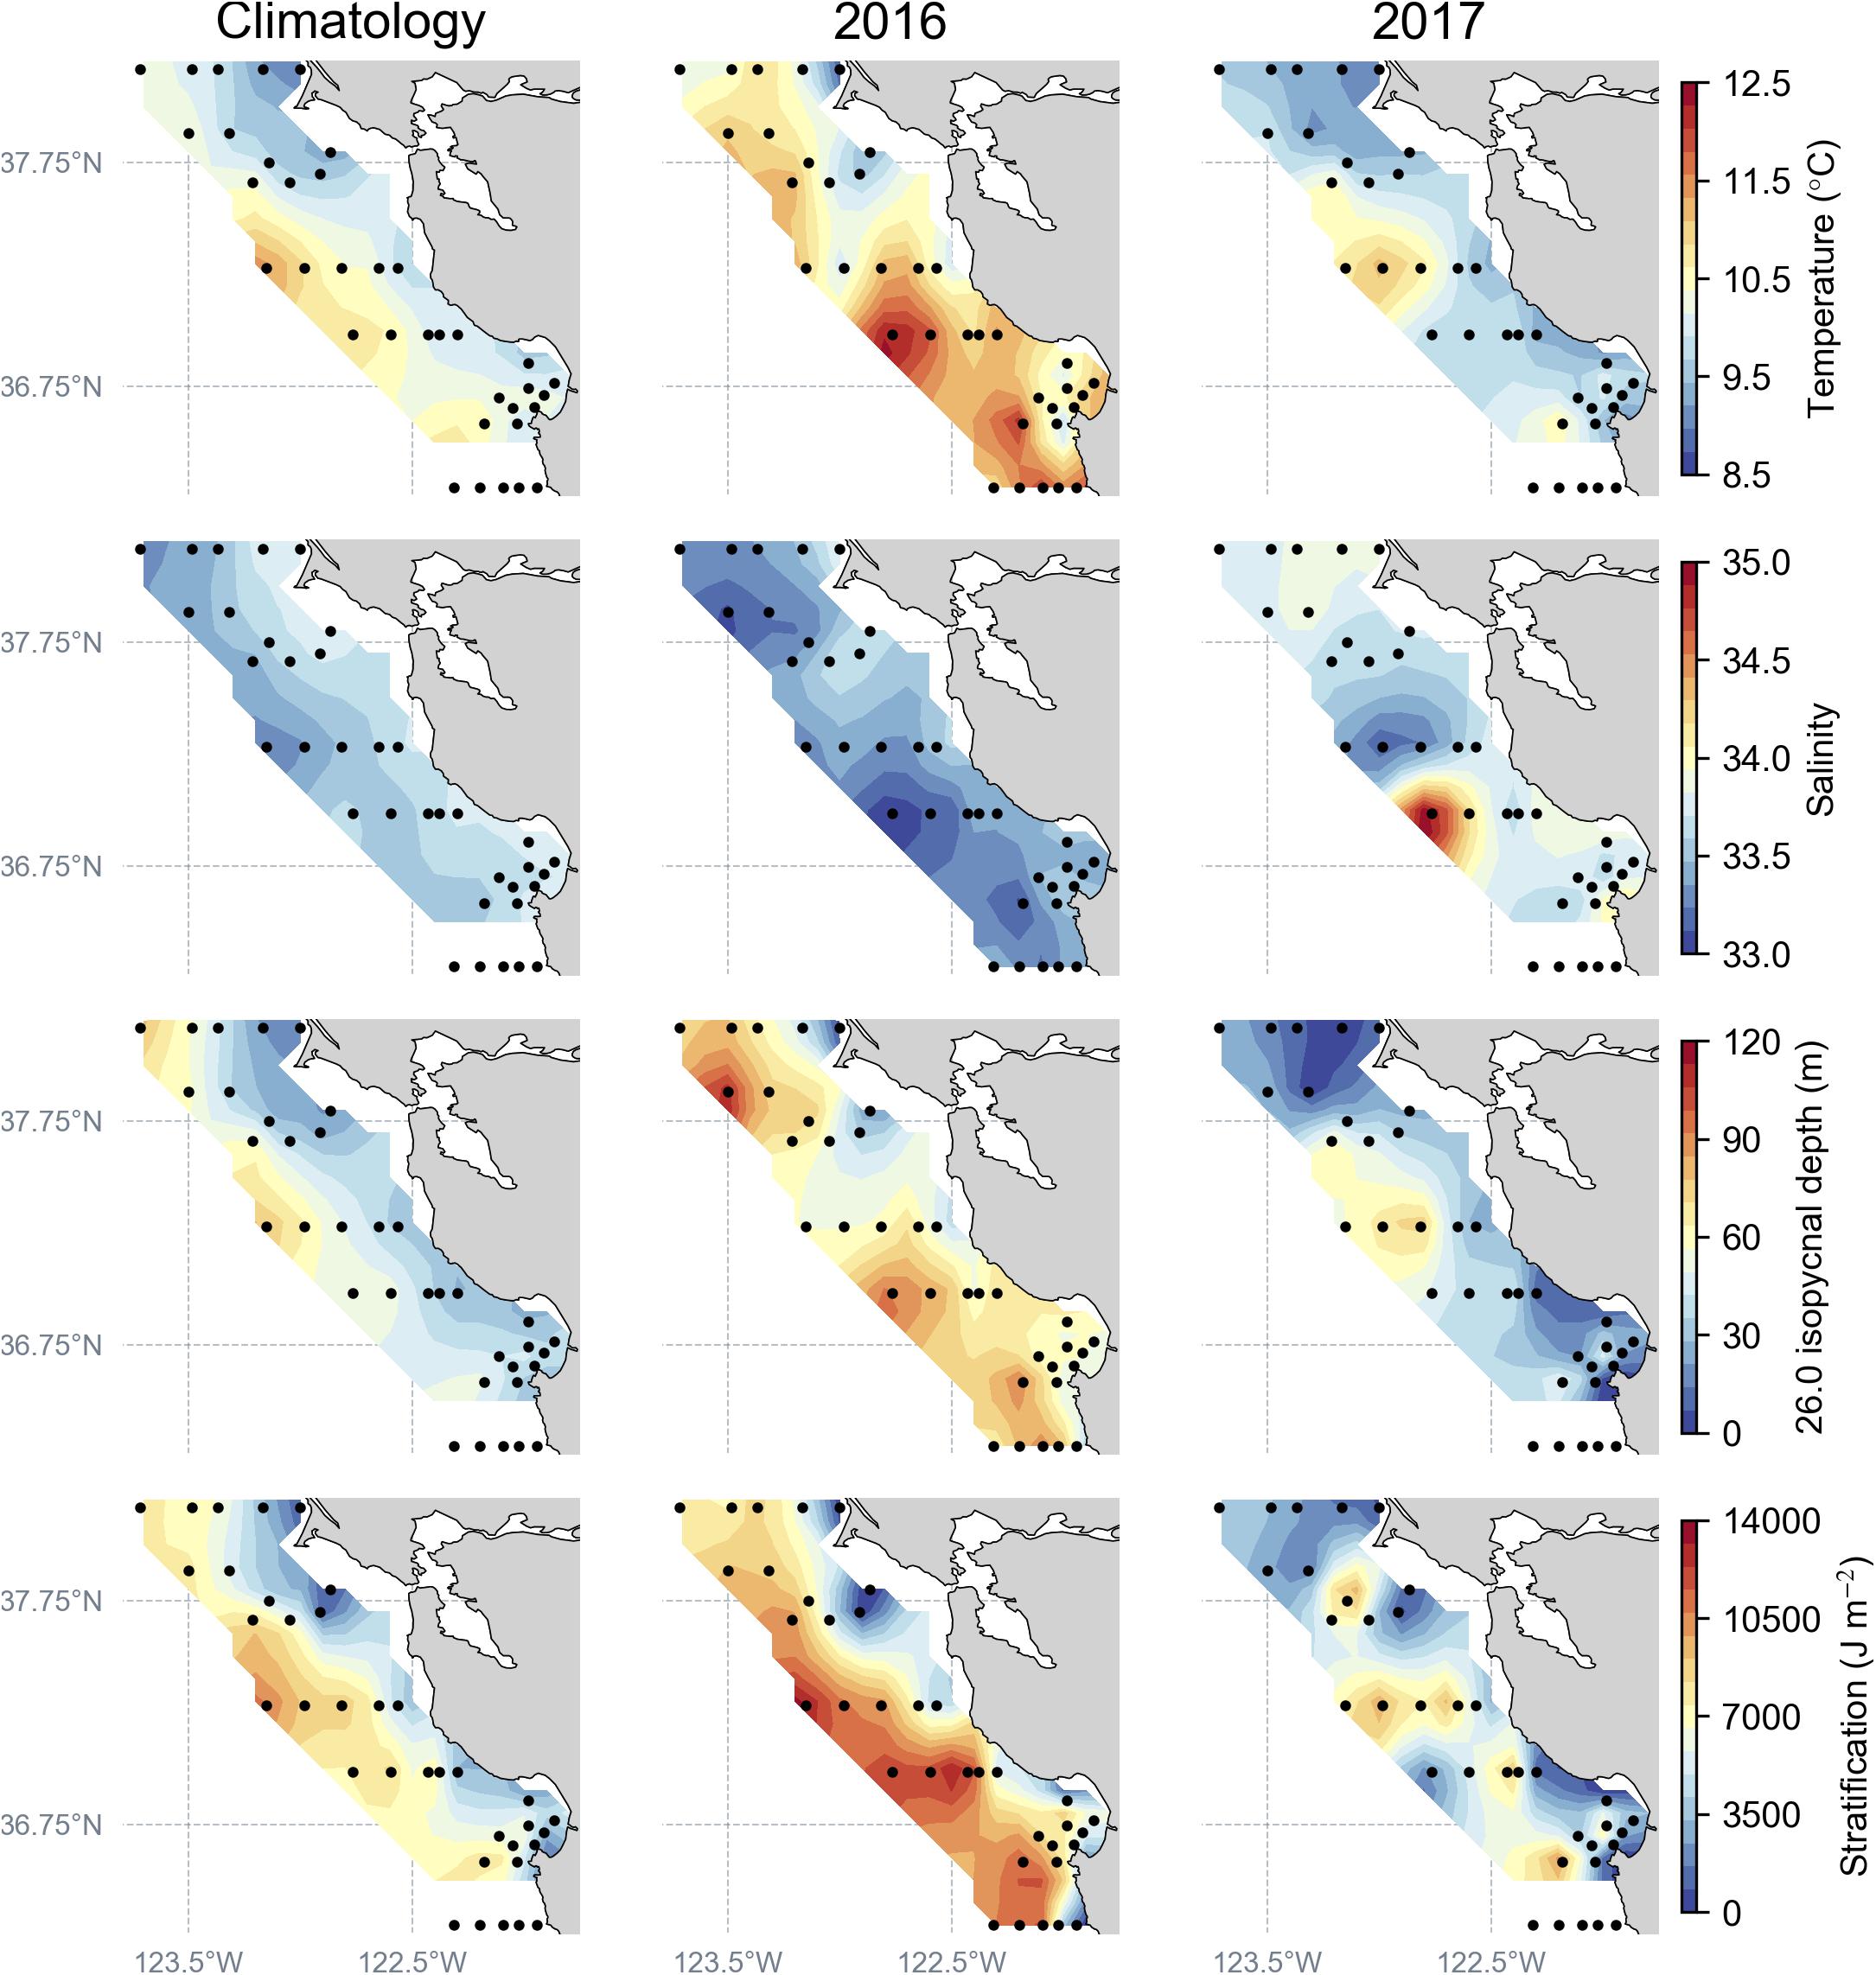
Figure 2. Regional ocean conditions, determined by the full set of CTD sampling stations (black dots) during April–May, to construct the spatial mean climatology (1990–2017) compared to April–May 2016 and 2017. Ocean condition parameters plotted: temperature and salinity at 20–40 m depth, depth of the 26.0 isopycnal, and stratification strength.
Epipelagic micronekton (free swimming organisms generally <200 mm) samples were collected at night using a modified Cobb mid-water trawl with a 9.5-mm cod-end liner, and 15-min tows were made at each station with a headrope depth of 30 m (Sakuma et al., 2016). Around 150 trawls are conducted each year during the RREAS. For this study, a total of 14 hauls (seven each year) were conducted at stations that overlapped with eDNA collections conducted earlier in the day. After each haul, organisms were separated, identified, and enumerated. Organism identification was either to the family, genus, or species level, depending on the degree to which the identity of the organism could be consistently discerned by survey staff at sea. Relative abundance was measured as catch-per-unit-effort (CPUE).
Visual marine mammal surveys were conducted concurrently during the 2016 eDNA water sampling, but not during the 2017 eDNA collection dates. Visual surveys for marine mammals were conducted during daylight hours while the vessel moved (at speeds greater than 5 knots) between hydrographic sampling stations (Santora et al., 2012). Visual surveys were conducted only during favorable sea-state conditions (e.g., no fog or glare and in Beaufort conditions <6). All sightings were recorded by an observer stationed on the flying bridge using binoculars and were entered into a mapping program that was synced to the ship’s navigational system. Marine mammal sightings included line-transect methodology (e.g., distance and bearing of cetaceans) to a maximum distance of 2 km (Santora et al., 2012). All sightings data were stored in a relational database identified down to species level or coarser taxonomic levels and organized into 3-km bins. Sightings data for the five regions sampled in 2016 were subset and summarized.
Water samples for eDNA were collected on five days during the 2016 survey and four days during the 2017 survey. On each day, water samples were collected from three stations in a region during daytime CTD casts. The last cast of each day was just prior to the first mid-water trawl of the night. Seawater samples were collected from depths of 10, 40, or 80 m in triplicate (three Niskin bottles at each depth) with 10 L Niskins (General Oceanics, United States) on a 24-bottle rosette (Supplementary Table S1). It should be noted that it was operationally impossible to sterilize the Niskin bottles on the rosette sampler between sampling events. Using sterile 69-oz bags (Whirl-Pak; Nasco, United States), water samples were transferred from Niskin bottles to 250-ml single-use, sterile, Analytical Test Filter Funnels (Nalgene; Nunc, United States) fitted with 0.22-μm pore-size hydrophilic polyvinylidene fluoride (PVDF) filters (GVWP04700, Millipore, United States). Milli-Q ultrapure water (Millipore) was filtered to create a daily negative control collection blank sample (referred to by some authors as a filtration blank). A total volume of 1 L was filtered for both the environmental and collection blank samples with a six-valve vacuum manifold. A new sterile filtration funnel and filter were used for each sample. Filters were removed from funnels with sterile forceps and placed in sterile 5 ml screwcap tubes and frozen at −80°C until processing. Samples were labeled with the following naming convention: year_CTD number_station number_depth_replicate (e.g., 2016_006_116_80M_1). In order to process all filters at the same time and avoid laboratory bias, filters collected in 2016 were stored for 14 months prior to analysis while filters collected in 2017 were stored up to 2 months prior to analysis.
DNA Extraction
DNA was extracted from the filters using a modified DNeasy Blood & Tissue Kit (Qiagen, United States) extraction protocol with 0.75 g each of ashed and UV-irradiated 0.5-mm and 0.1-mm glass beads (BioSpec Products Inc., United States). For each day that extractions were performed, one extraction was conducted without a filter to serve as an extraction blank. In total, 188 samples were extracted: environmental samples (n = 164), collection blanks (n = 10), and extraction blanks (n = 14). Total DNA in each extract was quantified using a Qubit 2.0 Fluorometer and Qubit dsDNA HS assay (Invitrogen, United States) and then extracts were subsequently stored at −20°C (see Supplementary Table S2). The stepwise DNA extraction protocol is available at: dx.doi.org/10.17504/protocols.io.yrqfv5w. To serve as a positive control, an artificial community was constructed using DNA extracts from eight fish species (see Supplementary Supporting Materials and Supplementary Table S3). This artificial “mock” community is not meant to reflect the conditions encountered in seawater where DNA from fish is expected to be at much lower concentrations. Artificial communities are increasingly being used in amplicon sequencing studies, and their use is considered among best practices (Pollock et al., 2018).
12S rRNA Gene Amplification and Sequencing
Amplicons were generated through a two-step PCR procedure (O’Donnell et al., 2016), with the first PCR using non-index primers and the second PCR using unique indexed primers. To amplify DNA in each sample, the mitochondrial 12S rRNA gene was amplified using the MiFish-U primers (Miya et al., 2015) (F: GTCGGTAAAACTCGTGCCAGC, R: CATAGTGGGGTATCTAATCCCAGTTTG), which were designed to amplify fish DNA. All PCR reactions consisted of 7.2 μl of PCR-grade water, 0.8 μl of MiFish-U forward and reverse primer (10 μM), 10 μl of Qiagen HotStarTaq Plus MMX (2X), and 2 μl of DNA template (diluted 1:10). Each sample (both 2016 and 2017 environmental samples, collection blanks, extraction blanks, and artificial community) was run in triplicate along with separate no template controls (NTCs) per group of triplicates. Thermal cycling conditions for the first PCR began with an initialization step of 95°C for 5 min followed by 40 cycles of denaturation at 95°C for 15 s, annealing at 55°C for 30 s, and extension at 72°C for 30 s, then held at 4°C. PCR products from the triplicate PCR reactions were then pooled, and amplification was confirmed through visualization in a 1.5% agarose gel stained with ethidium bromide. Amplified samples were retained for the second PCR so long as the corresponding NTC was confirmed to contain no visible amplicon and there was a band in the gel indicating presence of the PCR product (ca. 170 bp in length). All amplicons and NTCs (even when NTCs did not contain amplification products that were visible in the gel) were cleaned with the Agencourt AMPure XP (Beckman Coulter, United States) using the manufacturer’s protocol and were used as template in the second PCR. The second PCR used the MiFish-U primers as stated above with the addition of a 6-base index (Supplementary Table S2 provides index for each sample). A unique index was applied to the 5′-end of both the forward and reverse primers for each sample and NTC. The thermal parameters of the second PCR were 95°C for 5 min followed by 20 cycles at 95°C for 15 s, 57°C for 30 s, and 72°C for 30 s, then held at 4°C. After the second amplification, tagged triplicate PCR products were pooled, and both NTCs and pooled products were visualized in a 1.5% agarose gel stained with ethidium bromide. If NTCs contained no visible amplicon, the corresponding amplified samples (product visualized in the gel) were cleaned as described above. Cleaned NTCs from the first PCR were divided into three pools per year, then carried forward to the second PCR, and tagged with unique indices to create six pools for sequencing. DNA in the cleaned PCR products was quantified using a Qubit 2.0 Fluorometer and Qubit dsDNA HS assay.
Three sequencing libraries were prepared. Tagged samples were assigned randomly to one of the three sequencing libraries. To each library, 50 ng of DNA was added from both the environmental and artificial community samples. The volume of extract of collection blanks, extraction blanks, and NTC pools added was chosen based on the average volume of environmental samples added to each library (Library 1 = 2.12 μl, Library 2 = 1.93 μl, and Library 3 = 1.84 μl). Library pool concentrations were confirmed using a Qubit dsDNA HS assay. Libraries were prepared according to the manufacturer’s protocols using 250 ng of DNA from each pool with the KAPA HyperPrep Kit (KAPA Biosystems, United States); each library was ligated with a NEXTflex DNA barcode (BIOO Scientific, United States) and cleaned with Agencourt AMPure XP. Each library was brought to 10 nM and run on a Bioanalyzer 2100 with a High Sensitivity DNA Assay (Agilent Technologies, United States) at the Stanford Functional Genomics Facility (SFGF) to confirm the library concentrations. All three libraries were sequenced at SFGF on an Illumina MiSeq platform using 250-bp, paired-end sequencing with the MiSeq Reagent kit V2 and 20% PhiX174 spike-in control.
Sequence Processing
Data obtained from the three libraries were processed using modified versions of both the banzai pipeline (O’Donnell, 2015) and methods described in Djurhuus et al. (2017). Filtering parameters are detailed in Supplementary Table S4. Paired forward and reverse reads were assembled with PEAR v0.9.6 (Zhang et al., 2014). Merged reads were then quality filtered with VSEARCH v1.8.0 (Rognes et al., 2016). Reads that passed quality filtering were demultiplexed and singletons were removed with the awk command. Primer sequences were removed from the reads using cutadapt v1.8.3 (Martin, 2011). Identical sequences were consolidated with a custom dereplication python script. Sequences were clustered using Swarm v2 (Mahé et al., 2015) to create operational taxonomic units (OTU; clustering = 97%). OTU sequences were annotated against the BLAST nucleotide database (BLASTN) (≥97% ID, E-value < 10–20, wordsize ≥30) and annotations were further refined with MEGAN v5.10.6 (Huson et al., 2016) (≥97% ID, E-value < 10–25, LCA 70, minimum score 140). We note that additional databases are currently available, including the one created recently by Sato and colleagues (Sato et al., 2018).
Sequences annotated to phyla other than Chordata were removed from the dataset. Annotations to Bos, Canis, Homo, Neovison, Ovis, and Sus genera were subsequently removed to retain OTUs exclusively classified as marine vertebrates (Supplementary Table S2). Each environmental and artificial community sample was then rarefied to 44,676 reads and read counts were then converted to binary data with the “rrarefy” and “decostand” functions, respectively, in vegan with R package v2.4-4 (Oksanen et al., 2017; R Core Team, 2017). This number of reads (44,676) was chosen because >95% of the environmental samples contained reads equal to or larger than this. Five environmental samples (2016_009_112_10M_2, 2016_104_1106_80M_2, 2017_005_0112_40M_3, 2017_009_1020_10M_3, and 2017_021_1046_10M_1) did not meet the rarefying threshold and were removed from the subsequent analyses (see Supplementary Table S2 for number of sequences). Annotations were assigned to the species level, where possible (n = 970 out of 1396 OTUs were assigned to the species level, 69% of the OTUs, which comprised 69 unique species, see Supplementary Table S5).
Statistical Analyses
To investigate whether the vertebrate assemblage differed among years, regions, or sample location (e.g., on or off the shelf and above or below the pycnocline), we conducted analysis of similarities (ANOSIM) with the Plymouth Routines in Multivariate Ecological Research software package v6.1.18 (PRIMER 6) (Clarke and Gorley, 2015). In some cases, nMDS plots were created to visualize the multi-dimensional data.
The null hypotheses tested were as follows: (1) marine vertebrate assemblages (identified by trawl or eDNA) are the same in 2016 and 2017, (2) marine vertebrate assemblages (identified by trawl or eDNA) are the same in the different geographic regions during a specific year, (3) marine vertebrate assemblages (identified by trawl or eDNA) are the same regardless of depth of the water column where the sample was collected (on the shelf <100 m deep or off the shelf >100 m deep), and (4) marine vertebrate assemblages (identified by trawl or eDNA) are the same whether sample depth was above or below the pycnocline (defined herein as the depth where the Brunt-Välsälä frequency is maximum). When hypotheses focused exclusively on data from a single year, samples from all regions studied in that particular year were used to test hypotheses. We considered five different regions in the analysis [Point Reyes, Pescadero, Monterey Bay, Point Sur, and Piedras Blancas] based on historical work in this region that suggests they can harbor distinct vertebrate assemblages (Santora et al., 2012). When hypotheses used data across the two years, we only used regions that were sampled in both years (Point Reyes, Pescadero, and Monterey Bay). ANOSIM analyses were conducted using Jaccard distance matrices. All analyses were conducted with a statistical significance threshold of α = 0.05.
To test null hypotheses 1–4, data described down to the lowest resolution for each method was used for the analyses. eDNA assemblages were represented using binary (presence/absence) OTU-level data from eDNA samples; and trawl assemblages were represented using binary mid-water trawl data with identifications down to the species level when available.
Vertebrate Assemblage Characterization and Biomonitoring Methods Comparisons
To characterize the assemblages and to allow for direct comparisons between eDNA, trawl, and marine mammal survey collections, organism identifications were truncated to the genus level. Further, we have reduced confidence in the species-level annotations for some species complexes. For example, two Sebastes species were added in equal DNA concentrations to the artificial community, but only one species was resolved in the annotations and the majority of the annotations were to the genus level, Sebastes (Supplementary Table S6). After truncating the species-level annotations, 95% of eDNA OTUs were annotated to the genus level with the remaining 53 OTUs to the family level, and 16 OTUs (two clades Ovalentaria and Eupercaria) that could not be resolved to the family level owing to disagreement among taxonomists on their family membership (Betancur-R et al., 2017).
When describing results from the different methods below, the organisms identified in the eDNA, trawl, or marine mammal visual survey data assigned to a genus, family, or clade are referred to as taxa. Taxa counts were converted to binary data (1 = presence, 0 = absence) for the comparisons. To illustrate the taxa diversity detected, we constructed a phylogentic tree using phyloT (Phylogenetic Tree Generator) and visualized the tree with the Interactive Tree of Life (Letunic and Bork, 2016). The tree can be visualized at https://itol.embl.de/tree/7393202124298011550441244. Additionally, we created an eDNA and trawl taxa accumulation curve using the “specaccum” function with the vegan package in R (Oksanen et al., 2017; R Core Team, 2017).
Results
Regional Ocean Conditions
By comparison to the long-term spatial climatology, ocean conditions during 2016 indicate increased sub-surface (30 m) warming, lower salinity, a deeper depth of the 26.0 isopycnal, and overall increased stratification strength, a pattern influenced by the lingering effects of the strong northeast Pacific marine heat wave (Di Lorenzo and Mantua, 2016; Figure 2). During 2017, ocean-climate conditions returned to long-term averaged conditions, and compared to 2016, measurements indicated cooler sub-surface temperatures and higher salinity values throughout the study region (Figure 2). Furthermore, during 2017, shallower 26.0 isopycnal depths and decreased stratification were observed throughout the region relative to 2016, with local maxima occurring off Point Reyes and Monterey Bay, indicating return to normal or average upwelling conditions (Figure 2).
eDNA Sequences
Paired-end sequencing resulted in a total of 41.6 M reads (Lib1 = 10,979,812 reads; Lib2 = 14,524,732 reads; Lib3 = 16,141,481 reads). Two of 10 field collection blanks contained 3 and 13 reads, respectively; the rest returned 0 reads. The 14 extraction blanks contained between 0 and 70 reads, with 5 of the 14 extraction blanks having reads with a mean of 6.7 reads. Two of the six pooled NTCs had reads, 2016_NTC_pool_2 = 10 and 2017_NTC_pool_2 = 346 reads. Given the low number of reads returned on these control samples, we concluded that there was minimal contamination and no adjustment was made for the reads detected in these controls. The vast majority of the reads from the control samples (91%) were annotated to Homo sapiens. We verified that there were no statistically significant differences in assemblages (as measured by ANOSIM) between libraries (data not shown).
The three artificial community replicates contained 123,077, 180,446, and 187,899 reads. All genera that composed the artificial community were identified in each replicate; however, the proportion of sequences were not equally distributed across the genera (Supplementary Table S6). We therefore concluded that metabarcoding data from the environmental samples should not be interpreted quantitatively and instead should be used to infer the presence or absence of an OTU. The 131 environmental samples retained after rarifying initially contained between 44,676 and 273,795 reads per sample. The rarefied environmental samples consisted of 1,396 unique OTUs.
Marine Vertebrate Taxa Assemblage Identified by eDNA
The 1,396 unique OTUs identified in the environmental samples using eDNA metabarcoding were annotated to 65 distinct marine vertebrate taxa (including fish and mammals) where a taxon is defined as a unique genus level or coarser taxonomic assignment (Figure 3). Of the 65 marine vertebrate taxa detected, 26 were identified in both years, while 16 were observed only in 2016 and 23 were observed only in 2017 (Table 1).
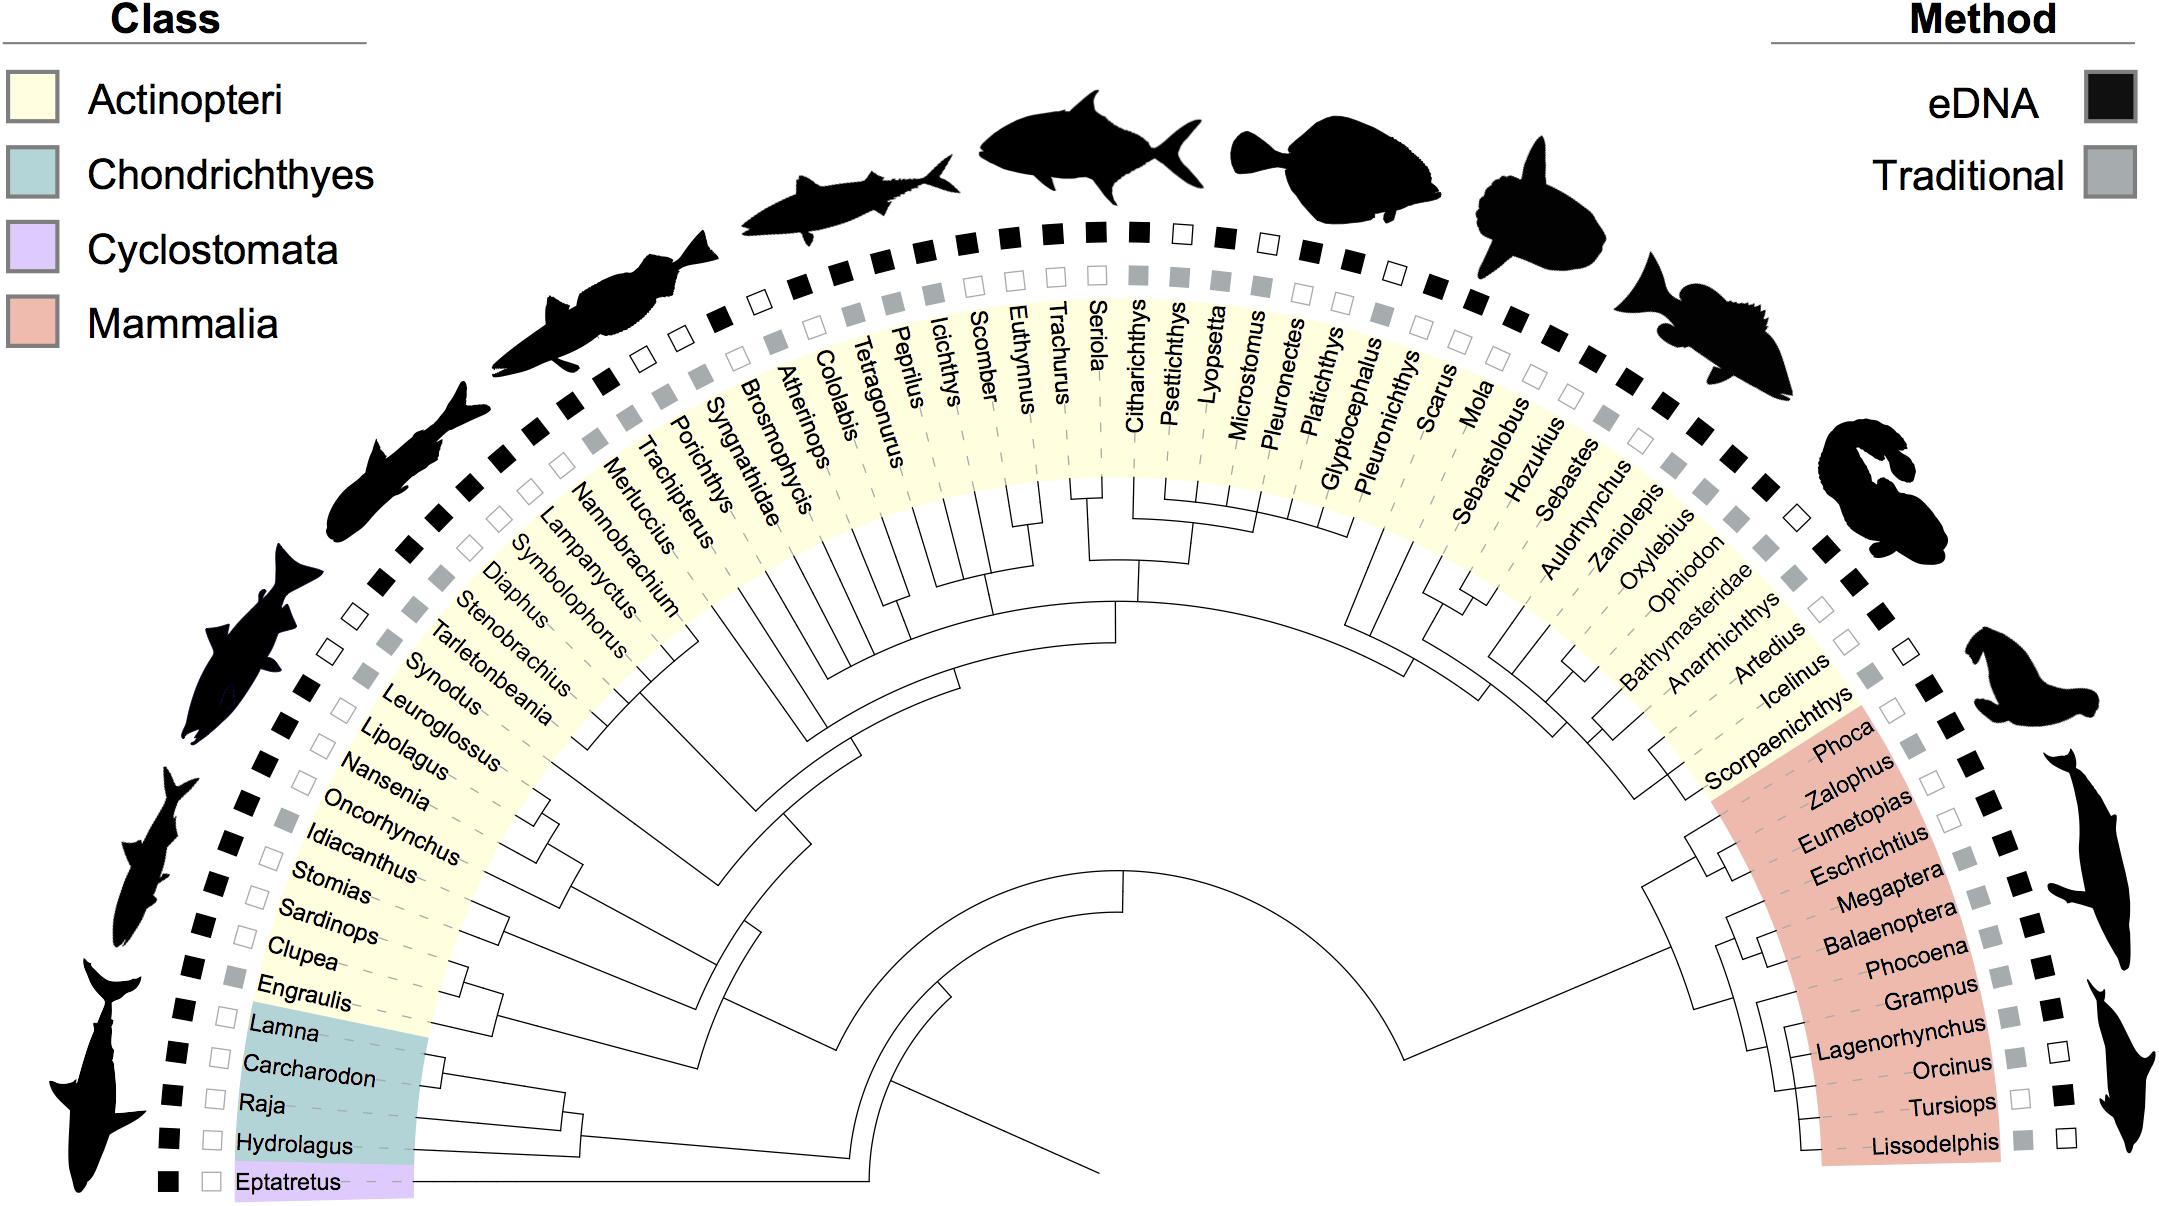
Figure 3. Phylogenetic tree of the taxa diversity identified by eDNA, trawl, and marine mammal surveys across the two-year dataset. Taxa are annotated down to the most resolved level (genus). Classes are identified by leaf color. If a taxon was identified by eDNA, the corresponding outer square is solid (black); if identified by traditional methods (i.e., mid-water trawl or marine mammal visual surveys), the inner square is solid (gray). Empty squares denote no detection for that method. Bathymasteridae and Syngnathidae had no genera detected; therefore, the taxa family names are listed in the tree. Refer to Table 1 for further information on which method detected certain taxa in a given year or region.
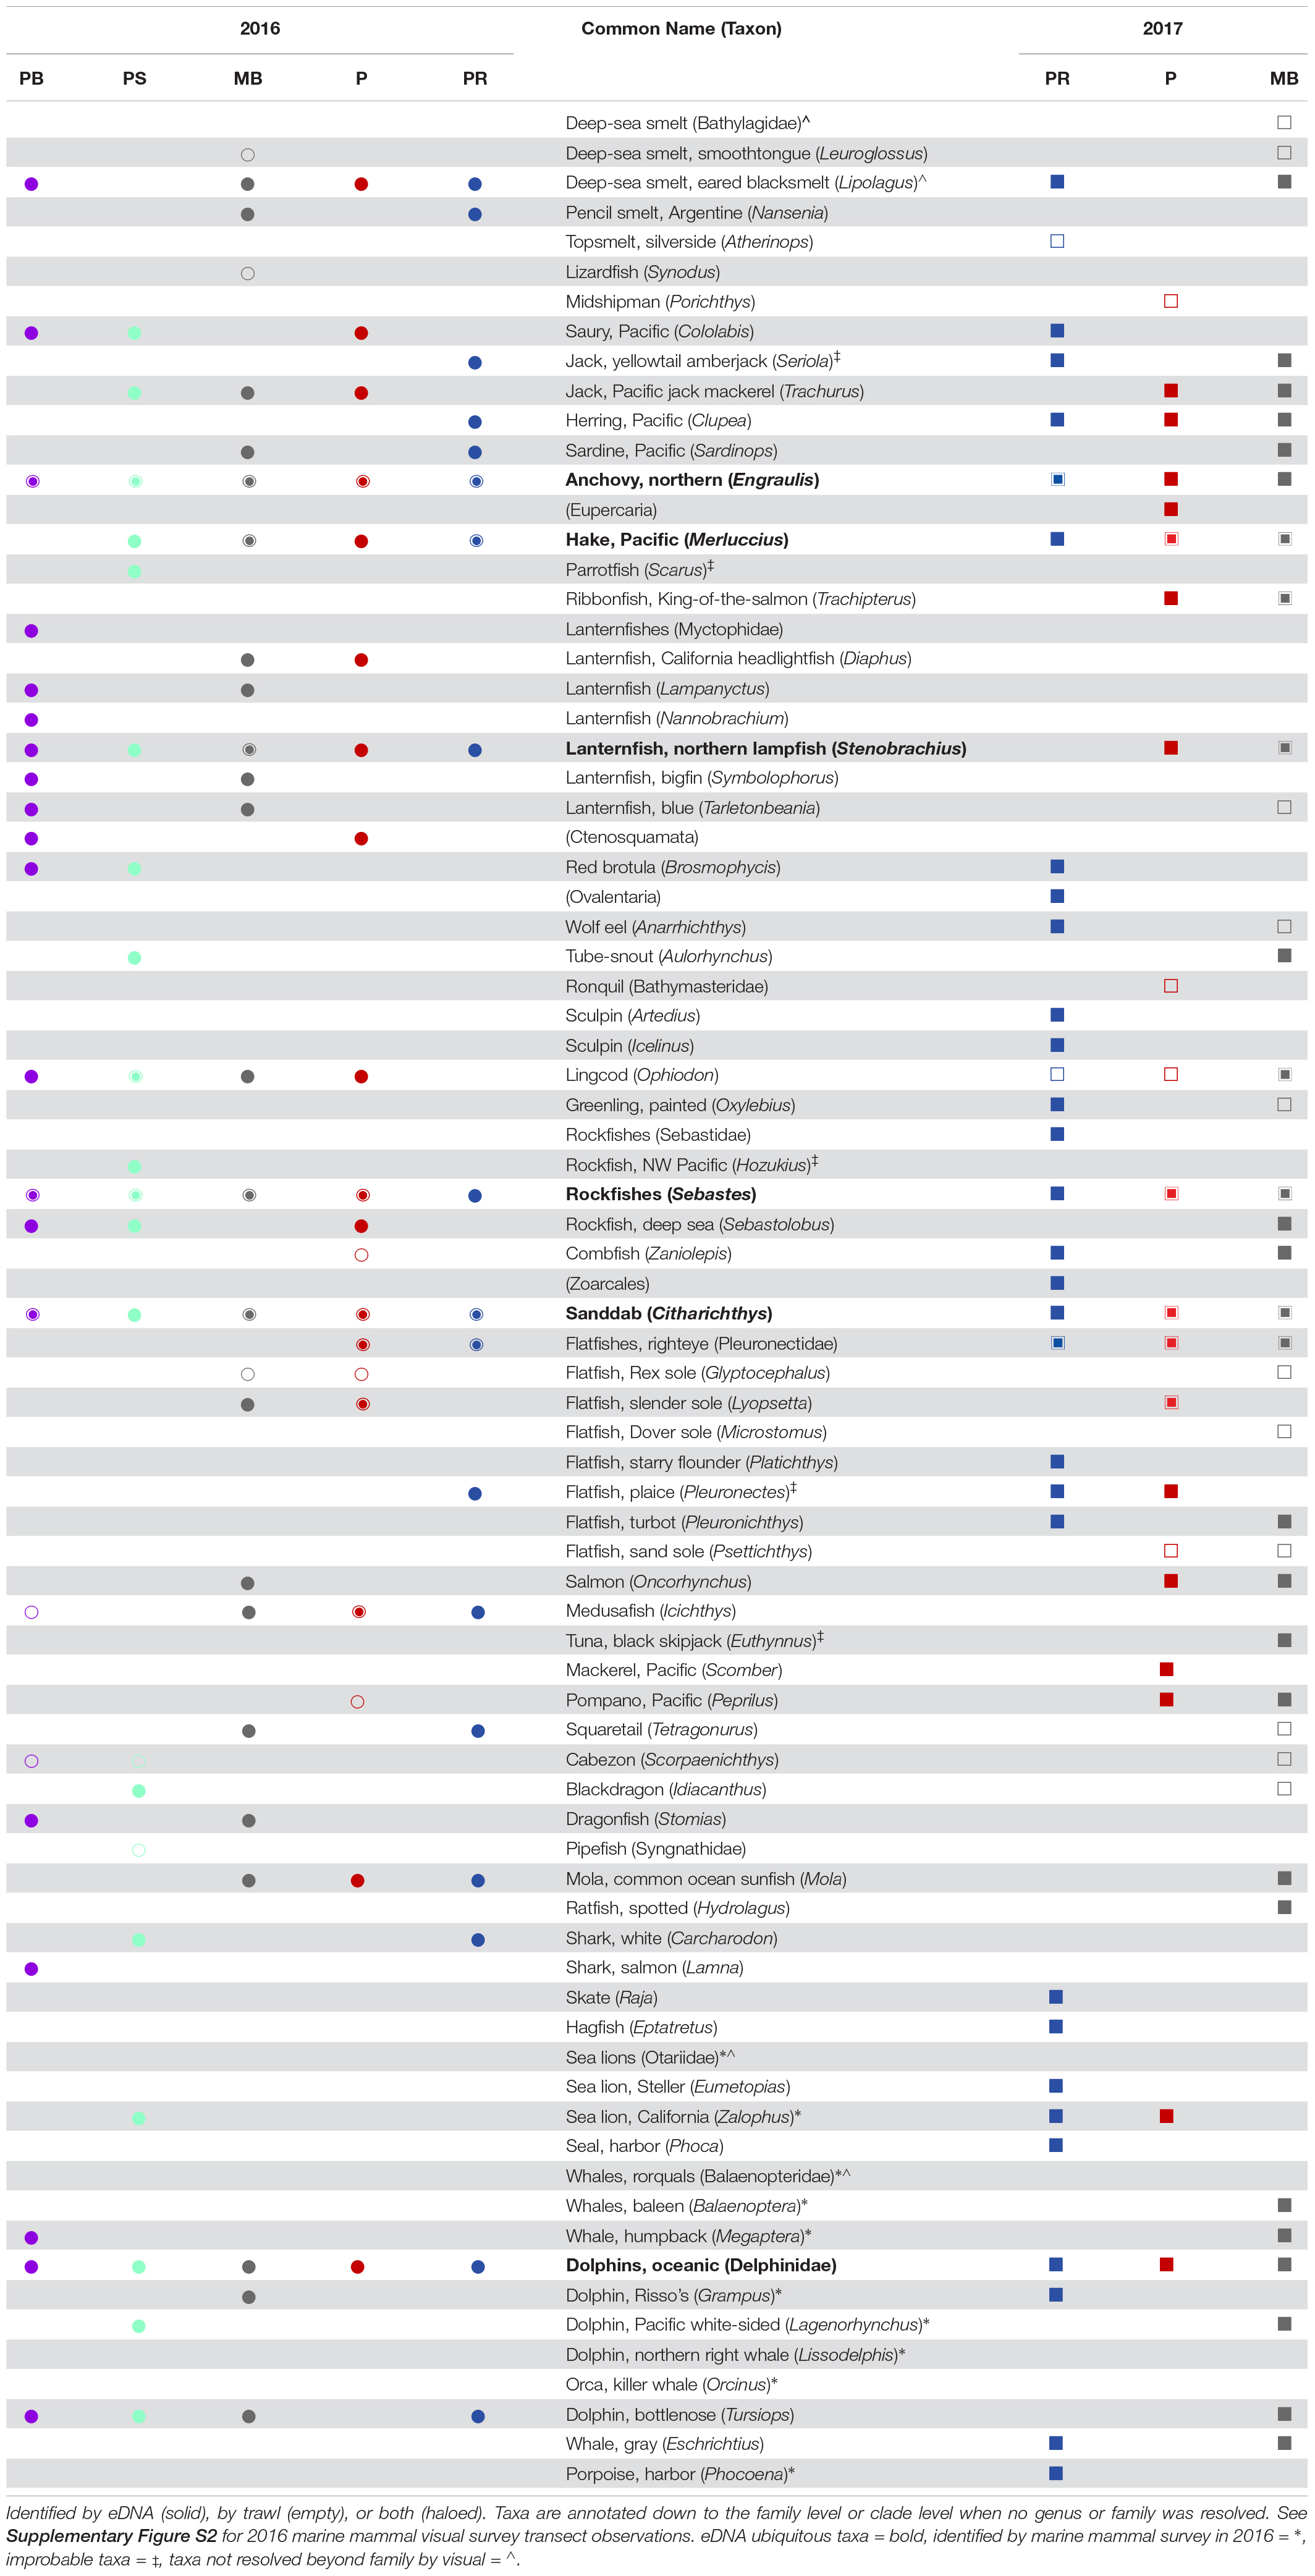
Table 1. Taxa identified across Point Reyes (PR), Pescadero (P), Monterey Bay (MB), Point Sur (PS), and Piedras Blancas (PB) in 2016 (circles), and 2017 (squares).
A total of 54 fish taxa were identified, 36 taxa in 2016 and 38 taxa in 2017, with 20 of those taxa identified in both years. The fish taxa identified were from three classes: Actinopteri, Chondrichthyes, and Cyclostomata. The majority of taxa detected in both years (49 of 54) were bony fishes in the class Actinopteri. Chondrichthyes (sharks and rays) were also identified in both years, while Cyclostomata (jawless fish) were detected in 2017 only. The ubiquitous fish taxa, defined here as taxa identified at more than half of the stations sampled in 2016 or 2017, were Sebastes (rockfish), Merluccius (hake), Engraulis (anchovy), and Citharichthys (sanddab). Stenobrachius (lanternfish) was one of six Myctophidae genera identified in 2016 and was identified at the majority of stations during 2016 (Supplementary Table S7), while Stenobrachius was the only Myctophidae genera identified in 2017 but at less than half the stations.
A total of 11 marine mammal taxa, including Balaenopteridae and Eschrichtiidae (baleen whales), Delphinidae (dolphins), Phocoenidae (porpoises), Phocidae (seals), and Otariidae (sealions), were identified using using eDNA across the two years. Six marine mammal taxa were identified in 2016, all of which were also identified in 2017 along with five additional marine mammal taxa, totaling 11 identified marine mammal taxa in 2017. In 2016, Delphinidae were detected at the majority of stations (9/15, 60%).
Interannual and Regional Variability of Vertebrate Assemblage Identified by eDNA
Comparison of the five regions sampled in 2016 indicate that the vertebrate marine assemblage differed significantly across the regions (R = 0.096, p = 0.002). Post hoc pairwise comparisons for 2016 indicated that Point Sur differed significantly from the northern regions: Point Reyes (R = 0.258, p = 0.001), Pescadero (R = 0.127, p = 0.048), and Monterey Bay (R = 0.198, p = 0.004). The 2016 assemblage from the southernmost (Piedras Blancas) region also significantly differed from the northernmost region (Point Reyes) (R = 0.165, p = 0.001). Across these five regions, the 2016 assemblages identified on or off the shelf and collected above or below the pycnocline were not different (p = 0.110 and 0.219, respectively).
Three of the five geographic regions were sampled in both 2016 and 2017: Point Reyes, Pescadero, and Monterey Bay. Comparing eDNA from these three regions across years indicate that the 2016 marine vertebrate assemblage differed significantly from the 2017 assemblage (R = 0.137, p = 0.001). A closer look at these three regions in 2016 alone indicates no statistically significant difference in assemblage among regions (R = 0.02, p = 0.261), but in 2017, the eDNA assemblage varied significantly across the three regions (R = 0.189, p = 0.001; post hoc indicated all were different from each other, p < 0.05 for all pairwise comparisons), indicating increased regional heterogeneity in the assemblage. Using eDNA data from these three regions, we found that in both 2016 and 2017, samples collected on the shelf (<100 m) were significantly different from samples collected off the shelf (R = 0.129, p = 0.046; R = 0.097, p = 0.007, respectively, for the two years). The 2016 and 2017 vertebrate assemblages inferred from eDNA collected from water sampled above the pycnocline were not significantly different from water sampled below the pycnocline (2016: p = 0.464; 2017: p = 0.061). Although statistically significant, the R-values are small, suggesting that other factors affect the structuring of the community compared to those investigated herein. nMDS plots in Supplementary Figure S1 illustrate weak clustering visually for statistically significant associations.
Marine Fish Assemblage Identified by Mid-Water Trawl
From the 14 mid-water trawls conducted (seven trawls each year), 28 unique vertebrate taxa were identified. In 2016, 16 taxa were identified by trawl, and in 2017, 23 taxa were identified. Eleven of the 28 trawl taxa were identified in both years. Trawl fish taxa in hauls corresponding to eDNA sampling were made up entirely of bony fishes, Actinopteri. The orders Perciformes and Pleuronectiformes (ray-finned and ray-finned demersal fishes) comprised the largest proportions of the taxa identified by trawl (6 out of 28, 21% each, 42% combined). Most of the taxa identified by trawl are bony fishes at the juvenile life stage that eventually grow beyond lengths of 200 mm. There were five ubiquitous fish taxa (defined previously) identified in the trawl samples; three taxa (Citharichthys, Engraulis, and Sebastes) and four taxa (Citharichthys, Merluccius, Ophiodon, and Sebastes) in 2016 and 2017, respectively.
Interannual and Regional Variability of Fish From Mid-Water Trawl Surveys
In 2016, the fish assemblage significantly differed among the five sampled regions (R = 0.868, p = 0.029). Most regions did not have replicate trawl collections that overlapped with eDNA collections, so post hoc comparisons could not be completed. Fish assemblage was not significantly different at stations on or off the shelf, and where trawls were conducted above or below the pycnocline (p = 0.714 and 0.857, respectively).
Comparing the fish assemblages observed in 2016 with those observed in 2017, there was no significant difference in the fish assemblages among the three regions that were sampled both years regardless of whether the data were examined in aggregate or by year (Point Reyes, Pescadero, and Monterey Bay; p > 0.05 for all). There was no significant difference between fish assemblages collected on-shelf vs. off-shelf in 2016 (p = 0.714) or in 2017 (p = 0.286). Further, fish assemblages collected in trawls conducted above and below the pycnocline were not significantly different in 2016 (p = 0.99). In 2017, trawls occurred exclusively below the pycnocline; thus, no pycnocline comparisons could be conducted.
eDNA Compared to Mid-Water Trawl Fish Survey
Combining both years, 48 fish taxa were identified by eDNA, of which 17 (35%) were also identified by trawl. An additional six taxa were identified by eDNA, but were considered implausible identifications due to either (1) mismatches between the observed and expected distribution of the taxa or (2) where genus-level identification cannot be easily discerned by visual identification (see Table 1). Thus, those six taxa are not included in the comparison of taxa identified by trawl and eDNA that follows. In total, 28 fish taxa were identified by trawl over the 2 years, of which 11 (39%) were identified by trawl and not by eDNA. Bathylagidae and Leuroglossus (both deep-sea smelts), Atherinops (topsmelt), Synodus (lizardfish), Porichthys (midshipman), Bathymasteridae (ronquils), Scorpaenichthys (cabezon), Syngnathidae (pipefish) as well as multiple Pleuronectidae–Glyptocephalus (rex sole), Microstomus (Dover sole), and Psettichthys (Pacific sand sole)–were all identified exclusively by trawl.
In 2016, 9 fish taxa were identified by both eDNA and trawl, 23 additional taxa were identified by eDNA only, and 7 fish taxa were identified by trawl only. Of the three regions from 2016 that were common between the two years, 8 fish taxa were identified by both eDNA and trawl, 18 additional taxa were identified by eDNA only, and 5 fish taxa were identified by trawl only. In 2017, 12 fish taxa were identified by both eDNA and trawl, 23 additional taxa were identified by eDNA only, and 11 fish taxa were identified by trawl only (Table 1).
eDNA Compared to Marine Mammal Survey
During 2016, over six days, a total of 539 km were sampled using visual survey methods to map the distribution of marine mammals. Ten mammal taxa were identified by visual survey. Of those taxa, four (Grampus, Lagenorhynchus, Megaptera, and Zalophus) were also identified by eDNA. In addition, Tursiops (bottlenose dolphin) were identified by eDNA in 2016, but were not identified by visual survey. eDNA did not detect Balaenoptera (blue or fin whale), Orcinus (killer whale), or Lissodelphis (right-whale dolphin) in 2016, which were detected by visual survey. Balaenopteridae (baleen whales) and Otariidae (eared seals or sea lions) were also detected by visual survey; although genera within those families were detected by eDNA, they were identified to a more resolved taxonomic level (Megaptera and Zalophus, respectively) (Table 1 and Supplementary Figure S2).
Discussion
In this study, eDNA metabarcoding identified more fish and marine mammal taxa than visual observations. Most of the fish and marine mammal taxa we identified using eDNA metabarcoding have been observed by trawl and marine mammal surveys during the RREAS over the last 35 years. Recognizing that eDNA was collected at more stations than the compared trawls, cumulatively, the molecular (eDNA) and traditional (trawl and marine mammal survey) observations identified 80 vertebrate taxa across the two years. eDNA detected 65 (81%) of these taxa, with more than half of the vertebrate taxa (n = 42) detected exclusively by eDNA. Of the 80 taxa, 13 taxa (11 fish and 2 marine mammal taxa) were identified exclusively with visual surveys and were not detected with eDNA. In 2016, the marine mammal survey identified more marine mammal taxa than did eDNA. These differences in the taxa detected by the different methods are not surprising because the trawl is designed to sample micronekton (e.g., epipelagic fish and invertebrates at <200 mm) using specific net mesh at a particular depth. Additionally, marine mammal visual surveys are conditional on sea state and number of observers conducting the survey. There were no marine mammal surveys to compare with eDNA in 2017, but the number of marine mammal taxa identified by eDNA that year was greater than was observed by both eDNA and visual survey in 2016. Notably, Eschrichtius (gray whale), Eumetopias (Steller sea lion), and Phoca (harbor seal) were additional taxa identified by eDNA in 2017. However, most of the taxa identified were not novel taxa for the area surveyed. Most of the fish taxa detected by eDNA have historically been identified by the last 2,200 trawls conducted since 1983, which have identified 116 unique genera or family taxa. All of the marine mammal taxa identified by eDNA have previously been identified by RREAS visual surveys.
Most taxa identified by eDNA were detected at only a few stations, but ubiquitous taxa were detected across the majority of stations either year. Of the fish taxa identified by eDNA over the two years, five were ubiquitous; four [Sebastes (rockfish), Merluccius (hake), Engraulis (anchovy), and Citharichthys (sanddab)] of which are managed fisheries along the West Coast of the United States. The distribution of these taxa also corresponds to the regionalization of species assemblages and their association with coastal upwelling patterns (Santora et al., 2012). Further, these taxa are an important component of seabird and marine mammal diet within the CCE (Szoboszlai et al., 2015), and their distribution and abundance are linked to their reproduction and population dynamics (Santora et al., 2014; Wells et al., 2017a; Warzybok et al., 2018). Most marine mammal taxa were also only detected with eDNA at a few stations, but Delphinidae were detected at the majority of stations in 2016. Previous visual surveys suggest that the distribution of most marine mammal taxa indicate specific habitat associations (i.e., on-shelf vs. off-shelf), whereas some taxa, such as dolphins, are considerably more broadly distributed (Santora et al., 2012). Therefore, the identification of broad and specific distribution patterns of taxa identified by eDNA compared to previous documented patterns from trawl and visual surveys lends credence to the use of eDNA metabarcoding for biomonitoring in this region.
Oceanic climate conditions differed substantially between 2016 and 2017, owing in part to the influence of the large marine heat wave and El Niño during 2015–2016 (Fiedler and Mantua, 2017). Upwelling was weak in 2016, as indicated by increased stratification and the depth of the 26.0 isopycnal, with relatively minimal mixing compared to the 27-year average for the region. By comparison to the long-term average, oceanographic conditions during 2017 are representative of an average upwelling year, with development of known upwelling shadows and retention zones in Gulf of the Farallones and northern Monterey Bay (Graham and Largier, 1997; Santora et al., 2012), as indicated by increased nearshore salinity, decreased stratification, and shoaling of the 26.0 isopycnal depth (Figure 2). Previous analysis of micronekton biodiversity derived from the trawl survey during the marine heat wave (2015) found increased species diversity throughout the study region, which differed markedly compared to a strong upwelling year (Santora et al., 2017). However, the fish assemblages derived from the limited number of trawls available during the eDNA sample collection period indicate that assemblages did not differ among regions (Point Reyes, Pescadero, and Monterey Bay) in 2016 or 2017, suggesting no discernable effect of the climatic conditions on the geographic distribution of fish assemblages. In contrast, the fish assemblages inferred from eDNA were not different among the regions in 2016, but were different among the regions in 2017. This may be suggestive of an effect of the ocean climate conditions on fish assemblages and that eDNA samples, due to their ability to sample a broader suite of taxa, were sufficient to detect a difference in species assemblages within an average upwelling year. Moreover, it is possible that there were not a sufficient number of trawl samples compared in this study to assess a difference in species assemblage distribution. For example, the long-term multivariate index of species assemblages for the trawl survey, based on all trawls within the survey area, indicate that species assemblages were at an average level during the return to normal upwelling conditions in 2017 following the marine heat wave (Wells et al., 2017b). Given that we contrasted two years involving unprecedented ocean warming and a normal upwelling year, the eDNA taxa identified and their distribution patterns help establish a baseline to develop further work to investigate the effect of interannual changes in oceanic regimes on fish populations using eDNA.
Based on the long-term average of the trawl survey, the primary mode of spatial variability for taxa assemblages reflects a clear separation of assemblages on-shelf vs. off-shelf (Santora et al., 2012). Taxa assemblages inferred from eDNA on the shelf were distinct from those off the shelf during both years. This difference between eDNA identified vertebrate assemblages on-shelf vs. off-shelf was also observed by Andruszkiewicz et al. (2017b) within Monterey Bay in 2015. This may reflect differences in preferred habitat of the taxa or their prey habitat preference. eDNA taxa assemblages above and below the pycnocline were not different. Many mesopelagic species exhibit diurnal vertical migration and therefore it is not surprising that no differences between assemblages above and below the pycnocline were detected by eDNA. Samples collected at a different time of year, from depths deeper than 80 m, or closer to the benthos, may provide contrasting assemblages from the epipelagic zone.
Geographic distributions differed between the years among some common taxa. For example, Myctophidae, a common mesopelagic fish family, was more diverse in 2016. Six different Myctophidae genera were identified by eDNA across the regions in 2016 compared to just one genus in 2017. The genus Stenobrachius was distributed across the majority of the 2016 stations, while in 2017, Stenobrachius was the only Myctophidae genera detected with eDNA and was detected at a minority of the stations (3 of 10). All of these identified Myctophidae taxa have previously been identified by the RREAS trawls within the studied region. Important fishery taxa such as Engraulis (anchovy) were identified by eDNA across all the regions both years, while Sardinops (sardine) were rarely detected. Anchovies were identified in every companion trawl from 2016, but in only one companion trawl in 2017, and sardines were not identified in the compared trawls from either year. Though sardines usually occur farther offshore than anchovies, the oscillating pattern between these two taxa has been historically noted (Rykaczewski and Checkley, 2008). While the population numbers of both fisheries are presently low compared to historic averages, directed sardine fishing has been closed since 2015 due to continued low population numbers (Thayer et al., 2017; Hill et al., 2018).
Several taxa that are not typically caught in the trawl survey, by virtue of their larger size and ability to avoid trawl gear, were identified using eDNA metabarcoding. For example, Oncorhynchus (salmon) was identified by eDNA in Monterey Bay in both 2016 and 2017 as well as near Pescadero in 2017. Clupea (herring) were detected with eDNA in Monterey Bay in 2017 and near Point Reyes in both 2016 and 2017, but are rarely caught by the trawl survey. Large chondrichthyans, such as Carcharodon (white shark), have low vulnerability to this trawl gear and thus rarely encountered in survey catches, but were identified using eDNA at Point Reyes both years. Similarly, Hydrolagus (ratfish) and Lamna (salmon shark) were identified by eDNA in 2016 and 2017, respectively, while Raja (skate) was identified in 2017 by eDNA. Some taxa identified by eDNA were extremely rare among the environments sampled and have known historical distributions, which do not typically overlap with the study’s regions, making their presence in the sample highly implausible [e.g., Euthynnus, Scarus, and Seriola (tropical); Hozukius (Northwest Pacific); and Pleuronectes (Atlantic and Alaska)]. For some of these taxa, the targeted gene region may not discriminate these taxa from closely related taxa or the representative entry within GenBank may have been mis-annotated (Tripp et al., 2011; Iwasaki et al., 2013; Heller et al., 2018). Additional work should be conducted to improve primer resolution, and additional voucher sequences from verified specimens should be deposited in open-access databases to improve species annotations of conserved gene regions. Future studies should consider manually curated reference databases like MitoFish (Sato et al., 2018) to improve sequence annotations.
Although visual surveys and eDNA detection of marine mammals did not yield sufficient sample sizes for direct comparisons, the distribution patterns of sightings and eDNA-based detections provide substantial support for eDNA methods for detecting marine mammals. Both visual survey and eDNA found nearshore species such as harbor porpoise close to land, clusters of baleen whales within Monterey Bay, and offshore species, such as Pacific white-sided dolphins and Risso’s dolphins, within outer slope habitat. The primers used for eDNA metabarcoding were optimized for fish (Miya et al., 2015); however, most of the organisms identified by the marine mammal visual survey were detected with eDNA. New mammal-specific primers targeting the mitochondrial 12S rRNA gene are now also available and can be used in future studies (Ushio et al., 2017). Marine mammal visual surveys were conducted during transects and not at station points; therefore, not all visual detections could correspond in space with eDNA collected at stations. Not all detections corresponded in time either, which could be due to individuals not being visually observed, multiple individuals from the same taxon in the study region, or movement of marine mammals. The mammal taxa identified by eDNA and visual surveys confirm known habitat associations of marine mammals within the study region (Santora et al., 2012).
One of the limitations to the study is that eDNA samples could not logistically be collected via rosette at the exact same time that trawl or visual surveys were conducted. The ship needs to move for trawls and mammal surveys are conducted while the ship transits between stations. Water samples must be collected while the ship is stationary, and to avoid trawl debris from contaminating eDNA samples, it was necessary to conduct water sampling prior to trawls. Overall, the eDNA sampling was matched to the time and location of the trawls as well as possible. The traditional surveys have not been designed to detect some of the organisms that are detected by eDNA (e.g., large bony fish), as some taxa may evade the trawl net or are difficult to assess via the marine mammal survey [e.g., beaked whales and small porpoises (Barlow and Forney, 2007)]. This study was conducted for an average of six days during both years, a subset of the RREAS’s typical assessment of 30–40 days involving hundreds of trawls. During this evaluation period, differences were noted by eDNA that were not identified by trawl. This may be due to the statistical tests conducted that were run with data at different resolutions, where eDNA comparisons were conducted using OTU-level data and trawl comparisons were conducted using data identified down to the family, genus, or species level. The differences noted between biomonitoring methods are undoubtedly in part due to the fact that twice as many taxa were identified using eDNA compared to trawls. This is likely due to a molecular advantage, where eDNA casts a “larger and finer resolution net,” compared to a specifically designed trawl net to sample micronekton.
Many trawls are required to achieve an accumulated assessment of species biodiversity of micronekton. An accumulation curve of trawl vertebrate taxa (Supplementary Figure S3) suggests that more trawls are needed beyond the subset of trawls that were used in this study to achieve taxa saturation. Santora et al. (2017) examined 26 years of trawl survey effort and an estimated ∼500 trawls are required to achieve a robust understanding of species diversity in the RREAS. An eDNA taxa accumulation curve (Supplementary Figure S3) suggests that taxa diversity across 2016 and 2017 begins to saturate after 120 samples are included. However, it is unclear how many eDNA samples would be needed to capture the same diversity observed in RREAS trawls across 26 years. As more eDNA samples are collected within this region, a power analysis can be undertaken to investigate how many eDNA samples are needed to document assemblage and diversity patterns. At the present time, the computational methods and sufficient information on within-sample and between-sample variability are lacking to carry out a power analysis for the ANOSIM method. Future efforts to develop such power analysis techniques could build off of those completed for PERMANOVA (Kelly et al., 2015) or Dirichlet Multinomial (La Rosa et al., 2012) methods (Knight et al., 2018). As described by Knight et al. (2018), power analysis remains a challenge in research involving amplicon sequencing data.
Traditional biomonitoring surveys also provide taxa abundance estimates, which this study does not address. Despite the noted differences among survey methods, eDNA offers novel insight as a tool to augment existing survey platforms, especially those aimed at monitoring biodiversity. However, as noted by other studies (Barange et al., 2009; Zwolinski et al., 2012), most fisheries surveys and species stock assessments are informed by relative abundance information, rather than presence–absence data, constraining potential applications of eDNA results in traditional fisheries management until reliable abundance information is achieved with molecular methods. Regardless, presence/absence information can still inform traditional surveys and assessments for some species, particularly uncommon marine mammals, large elasmobranchs, and other megafauna that are difficult to detect or resolve to a lower taxonomic classification with traditional survey methods. A novel application of presence-only eDNA biomonitoring may focus on assessment of indicator species that reflect extreme ocean climate and ecosystem shifts (e.g., sub-tropical fish species during an El Niño) to develop early warning signals to better inform the timing of expected shifts. Further, for some more traditional fisheries survey targets, it is well known that some populations, particularly those of coastal pelagic species, expand and/or contract their distribution and range in response to a combination of environmental factors and abundance levels (MacCall, 1990; Agostini et al., 2006), such that the distribution of a stock alone can provide insights into biomass levels (Barange et al., 2009). Similarly, some acoustic surveys require net sampling to apportion the species composition of the biomass estimates that are based on acoustic signals (Zwolinski et al., 2012). However, the net collections may not be conducted at the same time as the acoustic signal, trawl sampling limitations may constrain the number of trawls that can be collected, and the selectivity of different species to trawl gear may vary. Simultaneous eDNA collections could supplement, enhance, and help validate the species assignments of biomass in such surveys by providing presence information over considerably greater spatial scales. Furthermore, adding eDNA collection on acoustic-trawl surveys may improve our understanding of trophic interactions because eDNA could provide additional information on forage species assemblages and the occurrence of top predators (e.g., whales) that are interacting with both coastal pelagic and other forage species at local and regional scales (Fleming et al., 2016).
The comparison between eDNA and traditional biomonitoring methods highlights the novelty and strength of eDNA assessment for additional taxa compared to net tows and suggests that eDNA is a powerful tool for marine vertebrate detection. eDNA has enhanced the detection of organisms when paired with traditional biomonitoring methods (Kelly et al., 2017; Berry et al., 2019; Stat et al., 2019). Adding eDNA methods to the suite of biomonitoring techniques used during the RREAS and potentially other ecosystem biodiversity monitoring programs would enhance detection of organisms and aid in the biomonitoring of marine ecosystems. There is large uncertainty in how biodiversity responds to changes in climate, and increasing ocean-climate variability necessitates our better understanding of how marine vertebrates might respond. Baselines of biodiversity can be collected through eDNA, which can aid in the understanding of short-term or long-term changes by comparing to future collections (Jarman et al., 2018). While residence time for some species’ eDNA have been reported (Sassoubre et al., 2016; Jo et al., 2019), more studies on the fate and transport of eDNA (Andruszkiewicz et al., 2017a, 2019; Collins et al., 2018) will improve the use of eDNA to better understand the diurnal, seasonal, or anomalous distribution of select organisms. Extending long-term biomonitoring programs to include eDNA could improve taxon detection and resolve long-term patterns or changes in species of concern (Berry et al., 2019). For commercially important and managed vertebrates where abundance may be desired, species-specific qPCR assays could be designed to target eDNA of a particular taxon (Sassoubre et al., 2016; Lafferty et al., 2018; Jo et al., 2019). While this study provides one example of eDNA assessment for pelagic ecosystem biomonitoring targeting fish and mammal biodiversity, the method can be expanded to also detect other groups such as seabirds (Ushio et al., 2018) and sea turtles (Kelly et al., 2014). In addition, eDNA surveys beyond vertebrates is possible (Kelly et al., 2017; Berry et al., 2019; Sawaya et al., 2019), making the biomonitoring of entire ecosystems by eDNA plausible. Future studies should consider connecting microorganism assemblages with invertebrate and vertebrate assemblages to have a more robust understanding of the biodiversity interactions within an ecosystem.
Data Availability Statement
The raw sequence datasets generated for this study can be accessed under NCBI’s BioProject PRJNA525068 and Sequence Read Archive (SRA) submissions SAMN11041033 to SAMN11041035.
Author Contributions
CC, HS, EA, KS, JF, and AB conceived the study. CC, HS, EA, JS, and KS conducted the sample collection and lab analyses. CC, JS, IS, KS, JF, and AB conducted the data analysis. CC, JS, IS, and AB drafted the manuscript. All authors revised and edited the manuscript.
Funding
This research was funded by the Seaver Institute through a Stanford Woods Institute for the Environment Environmental Venture Project and the US National Ocean Partnership Program NOPP RFP NOAA-NOS-IOOS-2014-2003803 in partnership between NOAA, BOEM, NASA, the US Integrated Ocean Observing System (IOOS) Program Office, and NSF. The NASA grant number was NNX14AP62A [National Marine Sanctuaries as Sentinel Sites for a Demonstration Marine Biodiversity Observation Network (MBON)]. We would like to acknowledge additional financial support from the Packard Foundation.
Conflict of Interest
The authors declare that the research was conducted in the absence of any commercial or financial relationships that could be construed as a potential conflict of interest.
Acknowledgments
We would like to thank the following people and organizations: the officers and crew aboard the NOAA FSV Reuben Lasker that facilitated the collection of these samples and the running of daily operations during the cruise, the scientists on the NOAA-NMFS Rockfish Recruitment and Ecosystem Assessment Survey, the Farallon Institute for assistance with data collection, Reiko Michisaki for her continued efforts on improving sequencing pipeline infrastructure and technical support, and Rebecca Martone for her initial support in the collection of these eDNA samples. This manuscript is a contribution to the Marine Biodiversity Observation Network of the Group on Earth Observations Biodiversity Observation Network (MBON/GEO BON). The views expressed herein are those of the authors and do not necessarily reflect the views of BOEM, NASA, NOAA, or any of their sub-agencies. The US Government is authorized to reproduce this paper for governmental purposes.
Supplementary Material
The Supplementary Material for this article can be found online at: https://www.frontiersin.org/articles/10.3389/fmars.2019.00732/full#supplementary-material
Footnotes
References
Agostini, V. N., Francis, R. C., Hollowed, A. B., Pierce, S. D., Wilson, C., and Hendrix, A. N. (2006). The relationship between Pacific hake (Merluccius productus) distribution and poleward subsurface flow in the California Current System. Can. J. Fish. Aquat. Sci. 63, 2648–2659. doi: 10.1139/f06-139
Andruszkiewicz, E. A., Koseff, J. R., Fringer, O. B., Ouellette, N. T., Lowe, A. B., Edwards, C. A., et al. (2019). Modeling environmental DNA transport in the coastal ocean using lagrangian particle tracking. Front. Mar. Sci. 6:477. doi: 10.3389/fmars.2019.00477
Andruszkiewicz, E. A., Sassoubre, L. M., and Boehm, A. B. (2017a). Persistence of marine fish environmental DNA and the influence of sunlight. PLoS One 12:e0185043. doi: 10.1371/journal.pone.0185043
Andruszkiewicz, E. A., Starks, H. A., Chavez, F. P., Sassoubre, L. M., Block, B. A., and Boehm, A. B. (2017b). Biomonitoring of marine vertebrates in Monterey Bay using eDNA metabarcoding. PLoS One 12:e0176343. doi: 10.1371/journal.pone.0176343
Barange, M., Coetzee, J., Takasuka, A., Hill, K., Gutierrez, M., Oozeki, Y., et al. (2009). Habitat expansion and contraction in anchovy and sardine populations. Progr. Oceanogr. 83, 251–260. doi: 10.1016/j.pocean.2009.07.027
Barange, M., Merino, G., Blanchard, J. L., Scholtens, J., Harle, J., Allison, E. H., et al. (2014). Impacts of climate change on marine ecosystem production in societies dependent on fisheries. Nat. Clim. Chang. 4, 211–216. doi: 10.1038/nclimate2119
Barlow, J., and Forney, K. A. (2007). Abundance and population density of cetaceans in the California Current ecosystem. Fish. Bull. 105, 509–526.
Berry, T. E., Saunders, B. J., Coghlan, M. L., Stat, M., Jarman, S., Richardson, A. J., et al. (2019). Marine environmental DNA biomonitoring reveals seasonal patterns in biodiversity and identifies ecosystem responses to anomalous climatic events. PLoS Genet. 15:e1007943. doi: 10.1371/journal.pgen.1007943
Betancur-R, R., Wiley, E. O., Arratia, G., Acero, A., Bailly, N., Miya, M., et al. (2017). Phylogenetic classification of bony fishes. BMC Evol. Biol. 17:162. doi: 10.1186/s12862-017-0958-3
Boussarie, G., Bakker, J., Wangensteen, O. S., Mariani, S., Bonnin, L., Juhel, J.-B., et al. (2018). Environmental DNA illuminates the dark diversity of sharks. Sci. Adv. 4, eaa9661. doi: 10.1126/sciadv.aap9661
Checkley, D. M., and Barth, J. A. (2009). Patterns and processes in the California Current System. Progr. Oceanog. 83, 49–64. doi: 10.1016/j.pocean.2009.07.028
Cheung, W. W. L., Watson, R., and Pauly, D. (2013). Signature of ocean warming in global fisheries catch. Nature 497, 365–368. doi: 10.1038/nature12156
Collins, R. A., Wangensteen, O. S., O’Gorman, E. J., Mariani, S., Sims, D. W., and Genner, M. J. (2018). Persistence of environmental DNA in marine systems. Commun. Biol. 1:185. doi: 10.1038/s42003-018-0192-6
Di Lorenzo, E., and Mantua, N. (2016). Multi-year persistence of the 2014/15 North Pacific marine heatwave. Nat. Clim. Chang. 6, 1042–1047. doi: 10.1038/nclimate3082
Djurhuus, A., Port, J., Closek, C. J., Yamahara, K. M., Romero-Maraccini, O., Walz, K. R., et al. (2017). Evaluation of filtration and DNA extraction methods for environmental DNA biodiversity assessments across multiple trophic levels. Front. Mar. Sci. 4:314. doi: 10.3389/fmars.2017.00314
Edwards, M., Beaugrand, G., Hays, G. C., Koslow, J. A., and Richardson, A. J. (2010). Multi-decadal oceanic ecological datasets and their application in marine policy and management. Trends Ecol. Evol. 25, 602–610. doi: 10.1016/j.tree.2010.07.007
Fautin, D., Dalton, P., Incze, L. S., Leong, J.-A. C., Pautzke, C., Rosenberg, A., et al. (2010). An overview of marine biodiversity in United States waters. PLoS One 5:e11914. doi: 10.1371/journal.pone.0011914
Fiedler, P. C., and Mantua, N. J. (2017). How are warm and cool years in the California Current related to ENSO? J. Geophys. Res Oceans 122, 5936–5951. doi: 10.1002/2017JC013094
Fleming, A. H., Clark, C. T., Calambokidis, J., and Barlow, J. (2016). Humpback whale diets respond to variance in ocean climate and ecosystem conditions in the California Current. Global Change Biol. 22, 1214–1224. doi: 10.1111/gcb.13171
Foote, A. D., Thomsen, P. F., Sveegaard, S., Wahlberg, M., Kielgast, J., Kyhn, L. A., et al. (2012). Investigating the potential use of environmental DNA (eDNA) for genetic monitoring of marine mammals. PLoS One 7:e41781. doi: 10.1371/journal.pone.0041781
Graham, W. M., and Largier, J. L. (1997). Upwelling shadows as nearshore retention sites: the example of northern Monterey Bay. Cont. Shelf Res. 17, 509–532. doi: 10.1016/S0278-4343(96)00045-3
Haigh, R., Ianson, D., Holt, C. A., Neate, H. E., and Edwards, A. M. (2015). Effects of ocean acidification on temperate coastal marine ecosystems and fisheries in the northeast Pacific. PLoS One 10:e0117533. doi: 10.1371/journal.pone.0117533
Heller, P., Casaletto, J., Ruiz, G., and Geller, J. (2018). A database of metazoan cytochrome c oxidase subunit I gene sequences derived from GenBank with CO-ARBitrator. Sci. Data 5:180156. doi: 10.1038/sdata.2018.156
Hill, K., Crone, P., and Zwolinski, J. (2018). Assessment of the Pacific Sardine Resource in 2018 for U.S. Management in 2018-19. Washington, DC: US Department of Commerce.
Huson, D. H., Beier, S., Flade, I., Górska, A., El-Hadidi, M., Mitra, S., et al. (2016). MEGAN community edition - interactive exploration and analysis of large-scale microbiome sequencing data. PLoS Comput. Biol. 12:e1004957. doi: 10.1371/journal.pcbi.1004957
Iwasaki, W., Fukunaga, T., Isagozawa, R., Yamada, K., Maeda, Y., Satoh, T. P., et al. (2013). MitoFish and MitoAnnotator: a mitochondrial genome database of fish with an accurate and automatic annotation pipeline. Mol. Biol. Evol. 30, 2531–2540. doi: 10.1093/molbev/mst141
Jackson, J. B., Kirby, M. X., Berger, W. H., Bjorndal, K. A., Botsford, L. W., Bourque, B. J., et al. (2001). Historical overfishing and the recent collapse of coastal ecosystems. Science 293, 629–637. doi: 10.1126/science.1059199
Jarman, S. N., Berry, O., and Bunce, M. (2018). The value of environmental DNA biobanking for long-term biomonitoring. Nat. Ecol. Evol. 2, 1192–1193. doi: 10.1038/s41559-018-0614-3
Jo, T., Murakami, H., Yamamoto, S., Masuda, R., and Minamoto, T. (2019). Effect of water temperature and fish biomass on environmental DNA shedding, degradation, and size distribution. Ecol. Evo. 9, 1135–1146. doi: 10.1002/ece3.4802
Kaschner, K., Watson, R., Trites, A. W., and Pauly, D. (2006). Mapping world-wide distributions of marine mammal species using a relative environmental suitability (RES) model. Mar. Ecol. Progr. Ser. 316, 285–310. doi: 10.3354/meps316285
Keller, A. A., Wallace, J. R., Horness, B. H., Hamel, O. S., and Stewart, I. J. (2012). Variations in eastern North Pacific demersal fish biomass based on the U.S. west coast groundfish bottom trawl survey (2003-2010). Fish. Bull. 110, 205–222.
Kelly, B. J., Gross, R., Bittinger, K., Sherrill-Mix, S., Lewis, J. D., Collman, R. G., et al. (2015). Power and sample-size estimation for microbiome studies using pairwise distances and PERMANOVA. Bioinformatics 31, 2461–2468. doi: 10.1093/bioinformatics/btv183
Kelly, R. P., Closek, C. J., O’Donnell, J. L., Kralj, J. E., Shelton, A. O., and Samhouri, J. F. (2017). Genetic and manual survey methods yield different and complementary views of an ecosystem. Front. Mar. Sci. 3:283. doi: 10.3389/fmars.2016.00283
Kelly, R. P., Port, J. A., Yamahara, K. M., and Crowder, L. B. (2014). Using environmental DNA to census marine fishes in a large mesocosm. PLoS One 9:e86175. doi: 10.1371/journal.pone.0086175
Knight, R., Vrbanac, A., Taylor, B. C., Aksenov, A., Callewaert, C., Debelius, J., et al. (2018). Best practices for analysing microbiomes. Nat. Rev.. Microbiol. 16, 410–422. doi: 10.1038/s41579-018-0029-9
La Rosa, P. S., Brooks, J. P., Deych, E., Boone, E. L., Edwards, D. J., Wang, Q., et al. (2012). Hypothesis testing and power calculations for taxonomic-based human microbiome data. PLoS One 7:e52078. doi: 10.1371/journal.pone.0052078
Ladd, C., and Stabeno, P. J. (2012). Stratification on the Eastern Bering Sea shelf revisited. Deep Sea Res. Part II Top. Stud. Oceanogr. 6, 72–83. doi: 10.1016/j.dsr2.2012.02.009
Lafferty, K. D., Benesh, K. C., Mahon, A. R., Jerde, C. L., and Lowe, C. G. (2018). Detecting southern California’s white sharks with environmental DNA. Front. Mar. Sci. 5:355. doi: 10.3389/fmars.2018.00355
Letunic, I., and Bork, P. (2016). Interactive tree of life (iTOL) v3: an online tool for the display and annotation of phylogenetic and other trees. Nucleic Acids Res. 44, W242–W245. doi: 10.1093/nar/gkw290
Lubchenco, J., and Grorud-Colvert, K. (2015). Making waves: the science and politics of ocean protection. Science 350, 382–383. doi: 10.1126/science.aad5443
MacCall, A. D. (1990). Dynamic Geography of Marine Fish Populations. Seattle, WA: Washington Sea Grant Program.
Mahé, F., Rognes, T., Quince, C., de Vargas, C., and Dunthorn, M. (2015). Swarm v2: highly-scalable and high-resolution amplicon clustering. PeerJ 3, e1420. doi: 10.7717/peerj.1420
Martin, M. (2011). Cutadapt removes adapter sequences from high-throughput sequencing reads. EMBnet.J. 17:10. doi: 10.14806/ej.17.1.200
McCauley, D. J., Pinsky, M. L., Palumbi, S. R., Estes, J. A., Joyce, F. H., and Warner, R. R. (2015). Marine defaunation: animal loss in the global ocean. Science 347:1255641. doi: 10.1126/science.1255641
McClatchie, S., Duffy-Anderson, J., Field, J., Goericke, R., Griffith, D., Hanisko, D., et al. (2014). Long time series in US fisheries oceanography. Oceanography 27, 48–67. doi: 10.5670/oceanog.2014.86
Miya, M., Sato, Y., Fukunaga, T., Sado, T., Poulsen, J. Y., Sato, K., et al. (2015). MiFish, a set of universal PCR primers for metabarcoding environmental DNA from fishes: detection of more than 230 subtropical marine species. R. Soc. Open Sci. 2:150088. doi: 10.1098/rsos.150088
National Research Council (1992). Conserving Biodiversity: A Research Agenda for Development Agencies. Washington, DC: National Research Council.
O’Donnell, J. L. (2015). Banzai: Scripts for Analyzing Illumina-Generated Environmental DNA Sequence Data. Available at: https://github.com/jimmyodonnell/banzai (accessed October 1, 2016).
O’Donnell, J. L., Kelly, R. P., Lowell, N. C., and Port, J. A. (2016). Indexed PCR primers induce template-specific bias in large-scale DNA sequencing studies. PLoS One 11:e0148698. doi: 10.1371/journal.pone.0148698
Oksanen, J., Blanchet, F. G., Friendly, M., Kindt, R., Legendre, P., McGlinn, D., et al. (2017). vegan: Community Ecology Package. Available at https://CRAN.R-project.org/package=vegan (accessed May 30, 2018).
O’Leary, B. C., Winther-Janson, M., Bainbridge, J. M., Aitken, J., Hawkins, J. P., and Roberts, C. M. (2016). Effective coverage targets for ocean protection. Conserv. Lett. 9, 398–404. doi: 10.1111/conl.12247
Pauly, D., Christensen, V., Guénette, S., Pitcher, T. J., Sumaila, U. R., Walters, C. J., et al. (2002). Towards sustainability in world fisheries. Nature 418, 689–695. doi: 10.1038/nature01017
Pochon, X., Bott, N. J., Smith, K. F., and Wood, S. A. (2013). Evaluating detection limits of next-generation sequencing for the surveillance and monitoring of international marine pests. PLoS One 8:e73935. doi: 10.1371/journal.pone.0073935
Pollock, J., Glendinning, L., Wisedchanwet, T., and Watson, M. (2018). The madness of microbiome: attempting to find consensus “best practice” for 16S microbiome studies. Appl. Environ. Microbiol. 84:e2627-17. doi: 10.1128/AEM.02627-17
Port, J. A., O’Donnell, J. L., Romero-Maraccini, O. C., Leary, P. R., Litvin, S. Y., Nickols, K. J., et al. (2016). Assessing vertebrate biodiversity in a kelp forest ecosystem using environmental DNA. Mol. Ecol. 25, 527–541. doi: 10.1111/mec.13481
Ralston, S., Field, J. C., and Sakuma, K. M. (2015). Long-term variation in a central California pelagic forage assemblage. J. Mar. Syst. 146, 26–37. doi: 10.1016/j.jmarsys.2014.06.013
Ralston, S., Sakuma, K. M., and Field, J. C. (2013). Interannual variation in pelagic juvenile rockfish (Sebastes spp.) abundance - going with the flow. Fish. Oceanogr. 22, 288–308. doi: 10.1111/fog.12022
Rognes, T., Flouri, T., Nichols, B., Quince, C., and Mahé, F. (2016). VSEARCH: a versatile open source tool for metagenomics. PeerJ 4, e2584. doi: 10.7717/peerj.2584
Rykaczewski, R. R., and Checkley, D. M. (2008). Influence of ocean winds on the pelagic ecosystem in upwelling regions. Proc. Natl. Acad. Sci. U.S.A. 105, 1965–1970. doi: 10.1073/pnas.0711777105
Sakuma, K. M., Field, J. C., Mantua, N. J., Ralston, S., Marinovic, B. B., and Carrion, C. N. (2016). Anomalous epipelagic micronekton assemblage patterns in the neritic waters of the California Current in spring 2015 during a period of extreme ocean conditions. California Coop. Oceanic Fish. Investig. Rep. 57, 163–183.
Santora, J. A., Field, J. C., Schroeder, I. D., Sakuma, K. M., Wells, B. K., and Sydeman, W. J. (2012). Spatial ecology of krill, micronekton and top predators in the central California Current: implications for defining ecologically important areas. Prog. Oceanogr. 106, 154–174. doi: 10.1016/j.pocean.2012.08.005
Santora, J. A., Hazen, E. L., Schroeder, I. D., Bograd, S. J., Sakuma, K. M., and Field, J. C. (2017). Impacts of ocean climate variability on biodiversity of pelagic forage species in an upwelling ecosystem. Mar. Ecol. Progr. Ser. 580, 205–220. doi: 10.3354/meps12278
Santora, J. A., Schroeder, I. D., Field, J. C., Wells, B. K., and Sydeman, W. J. (2014). Spatio-temporal dynamics of ocean conditions and forage taxa reveal regional structuring of seabird–prey relationships. Ecol. Appl. 24, 1730–1747. doi: 10.1890/13-1605.1
Sassoubre, L. M., Yamahara, K. M., Gardner, L. D., Block, B. A., and Boehm, A. B. (2016). Quantification of environmental DNA (eDNA) shedding and decay rates for three marine fish. Environ. Sci. Technol. 50, 10456–10464. doi: 10.1021/acs.est.6b03114
Sato, Y., Miya, M., Fukunaga, T., Sado, T., and Iwasaki, W. (2018). MitoFish and MiFish pipeline: a mitochondrial genome database of fish with an analysis pipeline for environmental DNA metabarcoding. Mol. Biol. Evol. 35, 1553–1555. doi: 10.1093/molbev/msy074
Sawaya, N. A., Djurhuus, A., Closek, C. J., Hepner, M., Olesin, E., Visser, L., et al. (2019). Assessing eukaryotic biodiversity in the Florida Keys National Marine Sanctuary through environmental DNA metabarcoding. Ecol. Evol. 9, 1029–1040. doi: 10.1002/ece3.4742
Schroeder, I. D., Santora, J. A., Bograd, S. J., Hazen, E. L., Sakuma, K. M., Moore, A. M., et al. (2018). Source water variability as a driver of rockfish recruitment in the California Current Ecosystem: implications for climate change and fisheries management. Can. J. Fish. Aquat. Sci. 76, 950–960. doi: 10.1139/cjfas-2017-0480
Schroeder, I. D., Santora, J. A., Moore, A. M., Edwards, C. A., Fiechter, J., Hazen, E. L., et al. (2014). Application of a data-assimilative regional ocean modeling system for assessing California Current System ocean conditions, krill, and juvenile rockfish interannual variability. Geophys. Res. Let. 41, 5942–5950. doi: 10.1002/2014GL061045
Sciberras, M., Jenkins, S. R., Kaiser, M. J., Hawkins, S. J., and Pullin, A. S. (2013). Evaluating the biological effectiveness of fully and partially protected marine areas. Environ. Evid. 2:4. doi: 10.1186/2047-2382-2-4
Somero, G. N., Beers, J. M., Chan, F., Hill, T. M., Klinger, T., and Litvin, S. Y. (2016). What changes in the carbonate system, oxygen, and temperature portend for the northeastern Pacific Ocean: a physiological perspective. Bioscience 66, 14–26. doi: 10.1093/biosci/biv162
Stat, M., John, J., DiBattista, J. D., Newman, S. J., Bunce, M., and Harvey, E. S. (2019). Combined use of eDNA metabarcoding and video surveillance for the assessment of fish biodiversity. Conserv. Biol. 33, 196–205. doi: 10.1111/cobi.13183
Szoboszlai, A. I., Thayer, J. A., Wood, S. A., Sydeman, W. J., and Koehn, L. E. (2015). Forage species in predator diets: synthesis of data from the California Current. Ecol. Inform. 29, 45–56. doi: 10.1016/j.ecoinf.2015.07.003
Thayer, J. A., McCall, A. D., Sydeman, W. J., and Davison, P. C. (2017). California anchovy population remains low, 2012-16. California Coop. Oceanic Fish. Invest. Rep. 58, 69–76.
Thomsen, P. F., Kielgast, J., Iversen, L. L., Møller, P. R., Rasmussen, M., and Willerslev, E. (2012). Detection of a diverse marine fish fauna using environmental DNA from seawater samples. PLoS One 7:e41732. doi: 10.1371/journal.pone.0041732
Thomsen, P. F., Møller, P. R., Sigsgaard, E. E., Knudsen, S. W., Jørgensen, O. A., and Willerslev, E. (2016). Environmental DNA from seawater samples correlate with trawl catches of subarctic, deepwater fishes. PLoS One 11:e0165252. doi: 10.1371/journal.pone.0165252
Tripp, H. J., Hewson, I., Boyarsky, S., Stuart, J. M., and Zehr, J. P. (2011). Misannotations of rRNA can now generate 90% false positive protein matches in metatranscriptomic studies. Nucleic Acids Res. 39, 8792–8802. doi: 10.1093/nar/gkr576
Ushio, M., Fukuda, H., Inoue, T., Makoto, K., Kishida, O., Sato, K., et al. (2017). Environmental DNA enables detection of terrestrial mammals from forest pond water. Mol. Ecol. Res. 17, e63–e75. doi: 10.1111/1755-0998.12690
Ushio, M., Murata, K., Sado, T., Nishiumi, I., Takeshita, M., Iwasaki, W., et al. (2018). Demonstration of the potential of environmental DNA as a tool for the detection of avian species. Sci. Rep. 8:4493. doi: 10.1038/s41598-018-22817-5
Warzybok, P., Santora, J. A., Ainley, D. G., Bradley, R. W., Field, J. C., Capitolo, P. J., et al. (2018). Prey switching and consumption by seabirds in the central California Current upwelling ecosystem: implications for forage fish management. J. Ma. Syst. 185, 25–39. doi: 10.1016/j.jmarsys.2018.04.009
Wells, B. K., Santora, J. A., Henderson, M. J., Warzybok, P., Jahncke, J., Bradley, R. W., et al. (2017a). Environmental conditions and prey-switching by a seabird predator impact juvenile salmon survival. J. Mar. Syst. 174, 54–63. doi: 10.1016/j.jmarsys.2017.05.008
Wells, B. K., Schroeder, I. D., Bograd, S. J., Hazen, E. L., Jacox, M. G., Leising, A., et al. (2017b). State of the California Current 2016–17: still anything but “normal” in the north. California Coop. Oceanic Fish. Invest. Rep. 58, 1–55.
Yamamoto, S., Masuda, R., Sato, Y., Sado, T., Araki, H., Kondoh, M., et al. (2017). Environmental DNA metabarcoding reveals local fish communities in a species-rich coastal sea. Sci. Rep. 7:40368. doi: 10.1038/srep40368
Zhang, J., Kobert, K., Flouri, T., and Stamatakis, A. (2014). PEAR: a fast and accurate Illumina Paired-End reAd mergeR. Bioinformatics 30, 614–620. doi: 10.1093/bioinformatics/btt593
Zwolinski, J. P., Demer, D. A., Byers, K. A., Cutter, G. R., Renfree, J. S., Sessions, T. S., et al. (2012). Distributions and abundances of Pacific sardine (Sardinops sagax) and other pelagic fishes in the California Current Ecosystem during spring 2006, 2008, and 2010, estimated from acoustic-trawl surveys. Fish. Bull. 110, 110–122.
Keywords: environmental DNA, marine biodiversity, vertebrates, fish, marine mammals, biomonitoring, ecosystem oceanography, marine sanctuaries
Citation: Closek CJ, Santora JA, Starks HA, Schroeder ID, Andruszkiewicz EA, Sakuma KM, Bograd SJ, Hazen EL, Field JC and Boehm AB (2019) Marine Vertebrate Biodiversity and Distribution Within the Central California Current Using Environmental DNA (eDNA) Metabarcoding and Ecosystem Surveys. Front. Mar. Sci. 6:732. doi: 10.3389/fmars.2019.00732
Received: 05 March 2019; Accepted: 11 November 2019;
Published: 16 December 2019.
Edited by:
Emanuele Di Lorenzo, Georgia Institute of Technology, United StatesReviewed by:
Joseph D. DiBattista, Australian Museum, AustraliaStefano Mariani, Liverpool John Moores University, United Kingdom
Copyright © 2019 Closek, Santora, Starks, Schroeder, Andruszkiewicz, Sakuma, Bograd, Hazen, Field and Boehm. This is an open-access article distributed under the terms of the Creative Commons Attribution License (CC BY). The use, distribution or reproduction in other forums is permitted, provided the original author(s) and the copyright owner(s) are credited and that the original publication in this journal is cited, in accordance with accepted academic practice. No use, distribution or reproduction is permitted which does not comply with these terms.
*Correspondence: Collin J. Closek, closek@gmail.com