
This page presents Kīlauea monitoring data collected over the past week, including summit crater floor elevation, earthquake rates, locations, and depths, and ground deformation data.
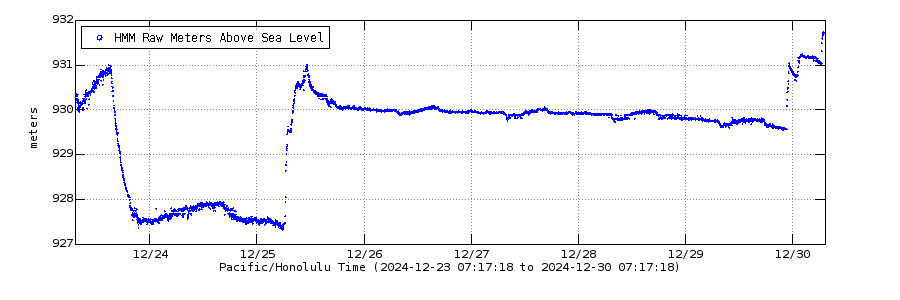
Halemaʻumaʻu crater floor elevation
Seismic Data
Earthquake Hypocenters Map and Cross Section
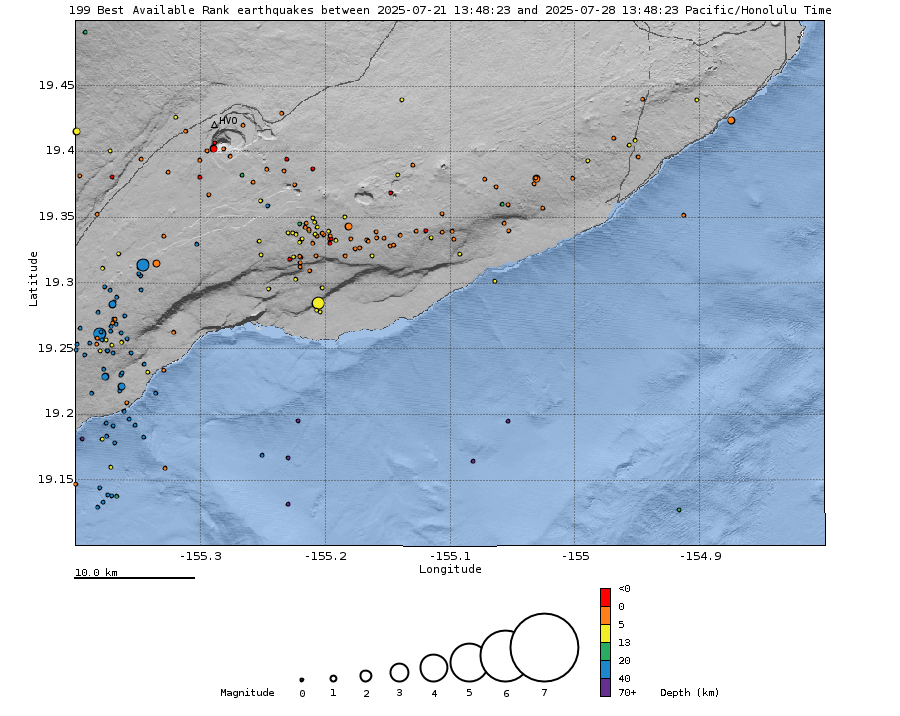
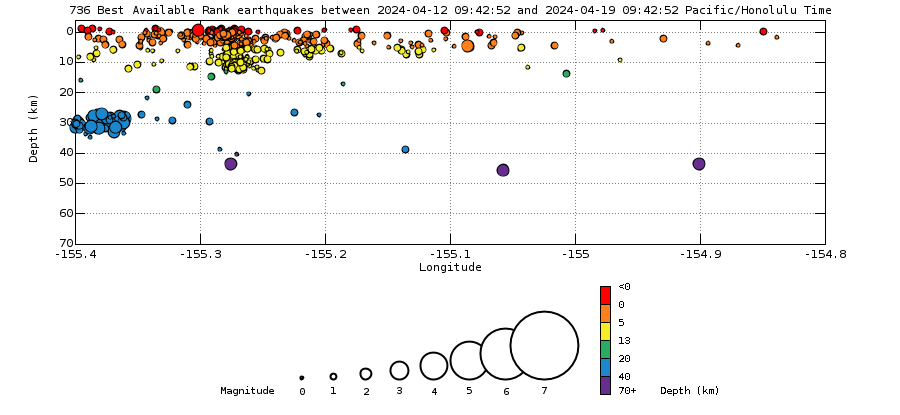
Above Top: Map showing locations of earthquakes during the past week. Bottom: Depth of earthquakes (circles) during the past week. Depth is reported relative to sea level, which is equal to a depth of zero on the above plot. Circle-size represents magnitude, and color indicates depth. An interactive earthquake plot can be found on the HVO Earthquakes page.
Earthquake Rates and Depths
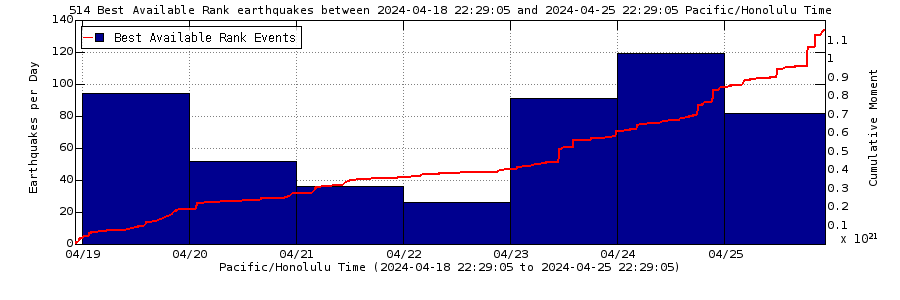
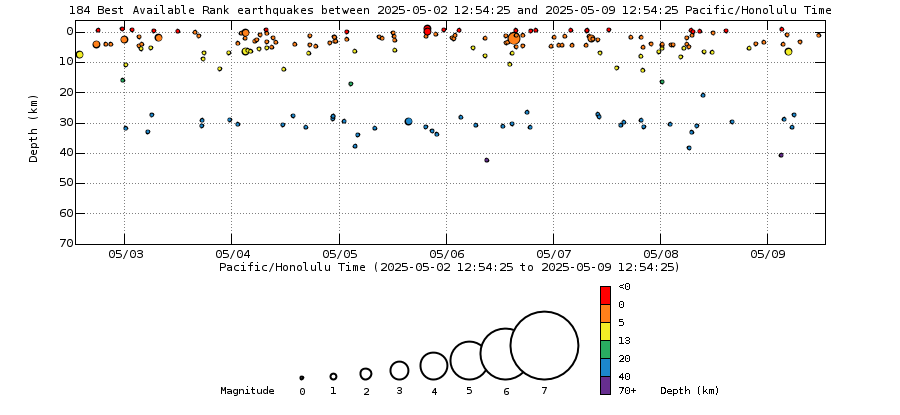
Above Top: Number of earthquakes per day during the past week (blue bars). The red line is the cumulative moment (energy) release. Bottom: Depth of earthquakes during the past week in the area shown on the map above. Depth is reported relative to sea level, which is equal to a depth of zero on the above plot. On both figures, circle-size represents magnitude, and color indicates depth. An interactive earthquake plot can be found on the HVO Earthquakes page.
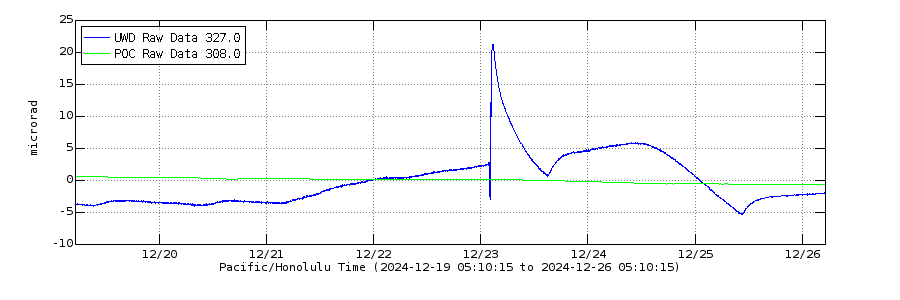
Deformation Data
Electronic Tilt at Kīlauea Summit and East Rift Zone - Past Week
Map of Selected Deformation Stations

For more information on how electronic tiltmeters and GPS receivers help monitor the deformation of Kīlauea Volcano, see the HVO Deformation page. Data plots from additional stations are available from our interactive map. Use the right-side menu to view different types of data.
This page presents Kīlauea monitoring data collected over the past week, including summit crater floor elevation, earthquake rates, locations, and depths, and ground deformation data.
Halemaʻumaʻu crater floor elevation
Seismic Data
Earthquake Hypocenters Map and Cross Section
Above Top: Map showing locations of earthquakes during the past week. Bottom: Depth of earthquakes (circles) during the past week. Depth is reported relative to sea level, which is equal to a depth of zero on the above plot. Circle-size represents magnitude, and color indicates depth. An interactive earthquake plot can be found on the HVO Earthquakes page.
Earthquake Rates and Depths
Above Top: Number of earthquakes per day during the past week (blue bars). The red line is the cumulative moment (energy) release. Bottom: Depth of earthquakes during the past week in the area shown on the map above. Depth is reported relative to sea level, which is equal to a depth of zero on the above plot. On both figures, circle-size represents magnitude, and color indicates depth. An interactive earthquake plot can be found on the HVO Earthquakes page.
Deformation Data
Electronic Tilt at Kīlauea Summit and East Rift Zone - Past Week
Map of Selected Deformation Stations
For more information on how electronic tiltmeters and GPS receivers help monitor the deformation of Kīlauea Volcano, see the HVO Deformation page. Data plots from additional stations are available from our interactive map. Use the right-side menu to view different types of data.