
Tax season can be stressful for the millions of Americans who owe money to Uncle Sam. Every year, the average U.S. household pays nearly $11,000 in federal income taxes. And while we’re all faced with that same obligation, there is significant difference when it comes to state and local taxes. Taxpayers in the most tax-expensive states, for instance, pay more than twice as much as those in the cheapest states.
Surprisingly, though, low income taxes don’t always mean low taxes as a whole. For example, while the state of Washington’s citizens don’t pay income tax, they still end up spending over 8% of their annual income on sales and excise taxes. Texas residents also don’t pay income tax, but spend 1.63% of their income on real estate taxes, one of the highest rates in the country.
As this year’s tax-filing deadline, April 15, comes closer WalletHub compared the 50 states and the District of Columbia against national medians to see where taxpayers pay the least and the most. We calculated relative income-tax obligations by applying the effective income-tax rates in each state and locality to the average American’s income.
Main Findings
Taxes by State
|
Overall Rank |
State |
Effective Total State & Local Tax Rates on Median U.S. Household* |
Annual State & Local Taxes on Median U.S. Household* |
% Difference Between State & U.S. Avg.** |
Annual State & Local Taxes on Median State Household*** |
Adjusted Overall Rank (based on Cost of Living Index) |
|---|---|---|---|---|---|---|
| 1 | Alaska | 6.73% | $5,089 | -38.37% | $5,788 | 7 |
| 2 | Delaware | 7.18% | $5,428 | -34.27% | $5,772 | 3 |
| 3 | Wyoming | 7.39% | $5,588 | -32.33% | $5,412 | 2 |
| 4 | Idaho | 7.76% | $5,868 | -28.93% | $5,863 | 1 |
| 5 | Montana | 7.91% | $5,977 | -27.62% | $5,748 | 4 |
| 6 | Colorado | 8.59% | $6,490 | -21.40% | $8,165 | 10 |
| 7 | Nevada | 8.59% | $6,494 | -21.36% | $6,757 | 13 |
| 8 | South Carolina | 8.69% | $6,566 | -20.48% | $5,543 | 5 |
| 9 | Florida | 8.69% | $6,571 | -20.43% | $6,241 | 6 |
| 10 | District of Columbia | 8.93% | $6,748 | -18.28% | $10,974 | 42 |
| 11 | North Dakota | 9.00% | $6,805 | -17.59% | $6,244 | 14 |
| 12 | California | 9.63% | $7,276 | -11.88% | $11,106 | 37 |
| 13 | New Hampshire | 9.67% | $7,312 | -11.46% | $8,667 | 29 |
| 14 | Utah | 9.77% | $7,381 | -10.61% | $8,974 | 19 |
| 15 | Missouri | 9.83% | $7,428 | -10.05% | $6,158 | 8 |
| 16 | South Dakota | 9.84% | $7,437 | -9.93% | $6,400 | 15 |
| 17 | Arizona | 10.02% | $7,575 | -8.27% | $7,612 | 20 |
| 18 | North Carolina | 10.05% | $7,598 | -7.99% | $6,629 | 11 |
| 19 | Tennessee | 10.18% | $7,696 | -6.80% | $6,513 | 9 |
| 20 | Georgia | 10.26% | $7,758 | -6.05% | $7,184 | 12 |
| 21 | West Virginia | 10.40% | $7,864 | -4.76% | $5,544 | 17 |
| 22 | Oregon | 10.56% | $7,982 | -3.34% | $9,301 | 34 |
| 23 | Alabama | 10.62% | $8,029 | -2.77% | $6,244 | 16 |
| 24 | Minnesota | 10.64% | $8,039 | -2.64% | $8,657 | 24 |
| 25 | Oklahoma | 10.70% | $8,087 | -2.07% | $6,115 | 18 |
| 26 | Virginia | 10.89% | $8,233 | -0.30% | $9,487 | 28 |
| 27 | Maine | 10.95% | $8,278 | 0.25% | $7,459 | 35 |
| 28 | New Mexico | 10.99% | $8,309 | 0.63% | $6,470 | 27 |
| 29 | Massachusetts | 11.24% | $8,498 | 2.91% | $12,156 | 46 |
| 30 | Rhode Island | 11.43% | $8,640 | 4.63% | $9,863 | 45 |
| 31 | Maryland | 11.47% | $8,666 | 4.95% | $11,445 | 44 |
| 32 | Indiana | 11.50% | $8,691 | 5.25% | $7,269 | 26 |
| 33 | Vermont | 11.55% | $8,728 | 5.69% | $8,521 | 41 |
| 34 | Arkansas | 11.61% | $8,777 | 6.29% | $6,357 | 21 |
| 35 | Kentucky | 11.70% | $8,845 | 7.11% | $6,779 | 22 |
| 36 | Michigan | 11.96% | $9,042 | 9.50% | $7,497 | 25 |
| 37 | Washington | 11.99% | $9,066 | 9.80% | $12,069 | 40 |
| 38 | Wisconsin | 12.14% | $9,172 | 11.08% | $8,198 | 33 |
| 39 | Mississippi | 12.21% | $9,232 | 11.80% | $6,418 | 23 |
| 40 | Hawaii | 12.27% | $9,274 | 12.31% | $12,772 | 50 |
| 41 | Louisiana | 12.36% | $9,346 | 13.18% | $7,125 | 31 |
| 42 | Texas | 12.55% | $9,483 | 14.84% | $8,643 | 32 |
| 43 | Ohio | 12.85% | $9,712 | 17.61% | $7,680 | 30 |
| 44 | Nebraska | 12.94% | $9,777 | 18.40% | $8,372 | 38 |
| 45 | Iowa | 13.20% | $9,979 | 20.84% | $8,148 | 36 |
| 46 | Kansas | 13.76% | $10,400 | 25.95% | $8,718 | 39 |
| 47 | Pennsylvania | 14.02% | $10,596 | 28.32% | $9,643 | 43 |
| 48 | New Jersey | 14.09% | $10,653 | 29.01% | $14,629 | 49 |
| 49 | Connecticut | 14.62% | $11,052 | 33.84% | $12,861 | 51 |
| 50 | New York | 14.71% | $11,119 | 34.65% | $13,342 | 48 |
| 51 | Illinois | 16.51% | $12,479 | 51.13% | $11,854 | 47 |
*Assumes “Median U.S. Household” has an annual income of $75,586 (mean third quintile U.S. income); owns a home valued at $281,900 (median U.S. home value); owns a car valued at $26,420 (the highest-selling car of 2023); and spends annually an amount equal to the spending of a household earning the median U.S. income.
**National Average of State and Local Tax Rates = 10.92%
***Assumes “Median State Household” has an annual income equal to the mean third quintile income of the state; owns a home at a value equal to the median of the state; owns a car valued at $26,420 (the highest-selling car of 2023); and spends annually an amount equal to the spending of a household earning the median state income.

- Lowest
- 1. Alaska
- 2. Missouri
- 3. Mississippi
- 4. Hawaii
- T-5. Arizona
- T-5. New Mexico
- Highest
- 47. Washington
- 48. Indiana
- 49. Pennsylvania
- 50. Illinois
- 51. California

- Lowest
- 1. Missouri
- 2. Georgia
- 3. North Dakota
- 4. North Carolina
- T-5. Idaho
- T-5. South Carolina
- Highest
- 47. Maryland
- 48. Rhode Island
- 49. Connecticut
- 50. District of Columbia
- 51. New York

- States with No Food Tax
- T-1. Alaska
- T-1. Arizona
- T-1. California
- T-1. Colorado
- T-1. Connecticut
- Worst
- 47. Missouri
- 48. Idaho
- 49. Kansas
- 50. Tennessee
- 51. Mississippi
*Note: Local Taxes are not included and can be substantial.
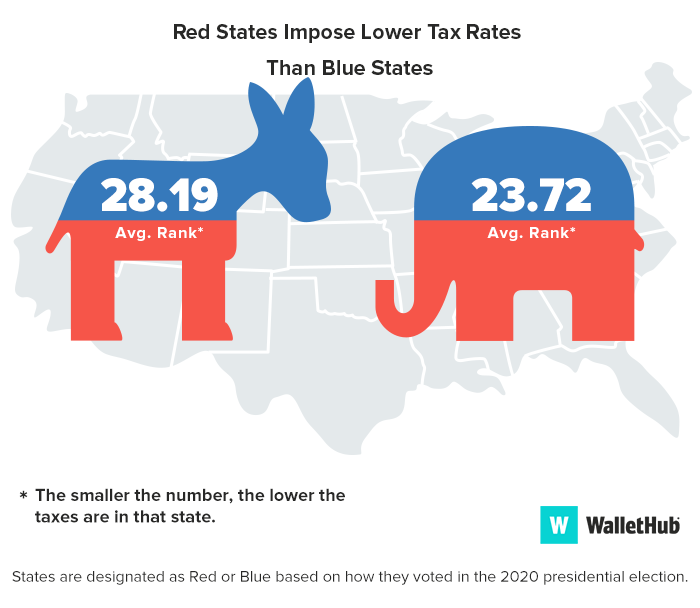
Blue vs. Red States
State & Local Tax Breakdown
All effective tax rates shown below were calculated as a percentage of the mean third quintile U.S. income of $75,586 and based on the characteristics of the Median U.S. Household*.
|
State |
Effective Real-Estate Tax Rate |
Real-Estate Tax Rank ($) |
Effective Vehicle Property Tax Rate |
Vehicle Property Tax Rank ($) |
Effective Income Tax Rate |
Income Tax Rank ($) |
Effective Sales & Excise Tax Rate |
Sales & Excise Tax Rank ($) |
Effective Total State & Local Tax Rates on Median U.S. Household* |
|---|---|---|---|---|---|---|---|---|---|
| Alaska | 4.32% | 35 ($3,268) | 0.00% | 1 ($0) | 0.00% | 1 ($0) | 2.41% | 5 ($1,821) | 6.73% |
| Delaware | 2.05% | 7 ($1,546) | 0.00% | 1 ($0) | 3.25% | 43 ($2,458) | 1.88% | 3 ($1,424) | 7.18% |
| Wyoming | 2.17% | 13 ($1,637) | 0.63% | 42 ($476) | 0.00% | 1 ($0) | 4.60% | 20 ($3,476) | 7.39% |
| Idaho | 2.11% | 12 ($1,591) | 0.00% | 1 ($0) | 1.97% | 28 ($1,489) | 3.69% | 8 ($2,788) | 7.76% |
| Montana | 2.95% | 22 ($2,231) | 0.42% | 33 ($316) | 3.11% | 41 ($2,350) | 1.43% | 1 ($1,081) | 7.91% |
| Colorado | 1.82% | 3 ($1,378) | 0.62% | 41 ($472) | 1.58% | 21 ($1,198) | 4.55% | 18 ($3,442) | 8.59% |
| Nevada | 1.88% | 4 ($1,421) | 0.62% | 40 ($469) | 0.59% | 10 ($448) | 5.50% | 37 ($4,156) | 8.59% |
| South Carolina | 1.96% | 5 ($1,484) | 0.88% | 49 ($668) | 1.48% | 19 ($1,117) | 4.36% | 15 ($3,297) | 8.69% |
| Florida | 3.05% | 24 ($2,302) | 0.00% | 1 ($0) | 0.00% | 1 ($0) | 5.65% | 41 ($4,269) | 8.69% |
| District of Columbia | 2.09% | 11 ($1,582) | 0.00% | 1 ($0) | 2.24% | 31 ($1,694) | 4.59% | 19 ($3,472) | 8.93% |
| North Dakota | 3.68% | 30 ($2,781) | 0.00% | 1 ($0) | 0.12% | 7 ($94) | 5.20% | 33 ($3,930) | 9.00% |
| California | 2.66% | 16 ($2,007) | 0.23% | 28 ($172) | 0.92% | 11 ($699) | 5.82% | 42 ($4,399) | 9.63% |
| New Hampshire | 7.05% | 48 ($5,329) | 0.63% | 42 ($476) | 0.41% | 9 ($310) | 1.58% | 2 ($1,198) | 9.67% |
| Utah | 2.05% | 8 ($1,546) | 0.00% | 1 ($0) | 2.33% | 34 ($1,762) | 5.39% | 36 ($4,073) | 9.77% |
| Missouri | 3.39% | 29 ($2,562) | 0.87% | 48 ($655) | 1.43% | 17 ($1,078) | 4.14% | 11 ($3,133) | 9.83% |
| South Dakota | 4.24% | 33 ($3,206) | 0.00% | 1 ($0) | 0.00% | 1 ($0) | 5.60% | 40 ($4,232) | 9.84% |
| Arizona | 2.07% | 10 ($1,567) | 0.59% | 39 ($444) | 1.00% | 12 ($757) | 6.36% | 43 ($4,808) | 10.02% |
| North Carolina | 2.74% | 17 ($2,069) | 0.40% | 32 ($304) | 1.89% | 25 ($1,429) | 5.02% | 29 ($3,795) | 10.05% |
| Tennessee | 2.18% | 14 ($1,647) | 0.00% | 1 ($0) | 0.22% | 8 ($170) | 7.78% | 49 ($5,879) | 10.18% |
| Georgia | 3.11% | 25 ($2,348) | 0.00% | 1 ($0) | 2.39% | 35 ($1,808) | 4.77% | 22 ($3,602) | 10.26% |
| West Virginia | 2.07% | 9 ($1,564) | 0.59% | 38 ($443) | 2.68% | 37 ($2,023) | 5.07% | 31 ($3,834) | 10.40% |
| Oregon | 3.20% | 27 ($2,421) | 0.00% | 1 ($0) | 5.34% | 51 ($4,033) | 2.02% | 4 ($1,528) | 10.56% |
| Alabama | 1.46% | 2 ($1,102) | 0.24% | 29 ($185) | 3.38% | 44 ($2,552) | 5.54% | 38 ($4,190) | 10.62% |
| Minnesota | 3.90% | 32 ($2,949) | 0.55% | 36 ($416) | 1.68% | 22 ($1,269) | 4.51% | 17 ($3,406) | 10.64% |
| Oklahoma | 3.16% | 26 ($2,389) | 0.00% | 1 ($0) | 1.95% | 27 ($1,474) | 5.59% | 39 ($4,224) | 10.70% |
| Virginia | 2.84% | 20 ($2,150) | 1.39% | 51 ($1,050) | 2.75% | 39 ($2,081) | 3.91% | 9 ($2,953) | 10.89% |
| Maine | 4.35% | 36 ($3,288) | 0.84% | 47 ($634) | 1.56% | 20 ($1,176) | 4.21% | 12 ($3,180) | 10.95% |
| New Mexico | 2.74% | 18 ($2,072) | 0.00% | 1 ($0) | 1.31% | 14 ($991) | 6.94% | 46 ($5,246) | 10.99% |
| Massachusetts | 4.30% | 34 ($3,253) | 0.79% | 46 ($594) | 3.09% | 40 ($2,338) | 3.06% | 6 ($2,312) | 11.24% |
| Rhode Island | 5.19% | 39 ($3,924) | 0.00% | 1 ($0) | 1.45% | 18 ($1,093) | 4.79% | 24 ($3,623) | 11.43% |
| Maryland | 3.80% | 31 ($2,875) | 0.00% | 1 ($0) | 3.42% | 46 ($2,588) | 4.24% | 13 ($3,204) | 11.47% |
| Indiana | 2.87% | 21 ($2,173) | 0.46% | 34 ($350) | 3.12% | 42 ($2,360) | 5.04% | 30 ($3,808) | 11.50% |
| Vermont | 6.65% | 47 ($5,028) | 0.00% | 1 ($0) | 1.39% | 15 ($1,050) | 3.50% | 7 ($2,649) | 11.55% |
| Arkansas | 2.20% | 15 ($1,665) | 0.36% | 31 ($269) | 1.91% | 26 ($1,442) | 7.15% | 47 ($5,402) | 11.61% |
| Kentucky | 2.99% | 23 ($2,258) | 0.51% | 35 ($382) | 3.41% | 45 ($2,575) | 4.80% | 25 ($3,629) | 11.70% |
| Michigan | 5.02% | 38 ($3,796) | 0.21% | 27 ($160) | 2.27% | 32 ($1,717) | 4.46% | 16 ($3,369) | 11.96% |
| Washington | 3.28% | 28 ($2,476) | 0.00% | 1 ($0) | 0.00% | 1 ($0) | 8.72% | 51 ($6,590) | 11.99% |
| Wisconsin | 5.92% | 44 ($4,471) | 0.00% | 1 ($0) | 2.16% | 30 ($1,631) | 4.06% | 10 ($3,071) | 12.14% |
| Mississippi | 2.83% | 19 ($2,138) | 1.21% | 50 ($915) | 1.76% | 23 ($1,330) | 6.42% | 44 ($4,849) | 12.21% |
| Hawaii | 1.00% | 1 ($757) | 0.00% | 1 ($0) | 3.71% | 48 ($2,807) | 7.55% | 48 ($5,710) | 12.27% |
| Louisiana | 2.04% | 6 ($1,545) | 0.03% | 26 ($26) | 2.27% | 33 ($1,719) | 8.01% | 50 ($6,055) | 12.36% |
| Texas | 6.07% | 45 ($4,586) | 0.00% | 1 ($0) | 0.00% | 1 ($0) | 6.48% | 45 ($4,896) | 12.55% |
| Ohio | 5.33% | 41 ($4,026) | 0.00% | 1 ($0) | 2.58% | 36 ($1,947) | 4.95% | 27 ($3,738) | 12.85% |
| Nebraska | 5.74% | 43 ($4,342) | 0.56% | 37 ($420) | 1.77% | 24 ($1,339) | 4.86% | 26 ($3,676) | 12.94% |
| Iowa | 5.55% | 42 ($4,196) | 0.35% | 30 ($264) | 2.09% | 29 ($1,578) | 5.21% | 34 ($3,940) | 13.20% |
| Kansas | 5.00% | 37 ($3,777) | 0.71% | 44 ($538) | 2.70% | 38 ($2,039) | 5.35% | 35 ($4,047) | 13.76% |
| Pennsylvania | 5.25% | 40 ($3,972) | 0.00% | 1 ($0) | 4.11% | 50 ($3,109) | 4.65% | 21 ($3,515) | 14.02% |
| New Jersey | 8.68% | 51 ($6,563) | 0.00% | 1 ($0) | 1.11% | 13 ($836) | 4.30% | 14 ($3,253) | 14.09% |
| Connecticut | 7.47% | 49 ($5,647) | 0.73% | 45 ($554) | 1.40% | 16 ($1,059) | 5.02% | 28 ($3,792) | 14.62% |
| New York | 6.12% | 46 ($4,626) | 0.00% | 1 ($0) | 3.80% | 49 ($2,873) | 4.79% | 23 ($3,620) | 14.71% |
| Illinois | 7.88% | 50 ($5,960) | 0.00% | 1 ($0) | 3.43% | 47 ($2,594) | 5.19% | 32 ($3,925) | 16.51% |
*Assumes “Median U.S. Household” has an income equal to $75,586 (mean third quintile U.S. income); owns a home valued at $281,900 (median U.S. home value); owns a car valued at $26,420 (the highest-selling car of 2023); and spends annually an amount equal to the spending of a household earning the median U.S. income.
Ask the Experts
For more insight into the impact state and local taxes have on migration and public policy, we turned to a panel of leading tax and policy experts. You can check out their bios and responses below.
- Do people usually consider taxes when deciding where to live? Should they?
- How can state and local tax policy be used to attract new residents and stimulate growth?
- Which states have particularly complicated tax rules for families?
- Which states have the best mix of taxes and government services?
- Should people pay taxes based on where they live or where they work?
Ask the Experts

Associate Professor, Accounting, Fuqua School of Business – Duke University
Read More

Professor of Political Science, School of Government and International Affairs – Kennesaw State University
Read More

Ph.D. – Associate Professor of Accounting; Academic Director, Neeley Fellows – Texas Christian University
Read More

Adjunct Professor – Walsh College
Read More

S.J.D. – Associate Professor, Director of the MTax Program, College of Business, The University of Akron
Read More
Methodology
In order to identify the states with the highest and lowest tax rates, WalletHub compared the 50 states and the District of Columbia across four types of taxation:
- Real-Estate Tax: We first divided the “Median Real-Estate Tax Amount Paid” by the “Median Home Price” in each state. We then applied the resulting rates to a house worth $281,900, the median value for a home in the U.S., in order to obtain the dollar amount paid as real-estate tax per household.
- Vehicle Property Tax: We examined data for cities and counties collectively accounting for at least 50 percent of the state’s population and extrapolated this to the state level using weighted averages based on population size. For each state, we assumed all residents own the same car: a Toyota Camry LE four-door sedan, 2023’s highest-selling car, valued at $26,420, as of January 2024.
- Income Tax: We used the percentage of income (middle income rate) spent on income tax from WalletHub’s Best States to Be Rich or Poor from a Tax Perspective report. “Income” refers to the mean third quintile U.S. income amount of $75,586.
- Sales & Excise Tax: We used the percentage of income (middle income rate) spent on sales and excise taxes from WalletHub’s Best States to Be Rich or Poor from a Tax Perspective report. “Income” refers to the mean third quintile U.S. income amount of $75,586.
Sources: Data used to create this ranking were collected as of February 12, 2024 from the U.S. Census Bureau, Bureau of Labor Statistics, Tax Foundation, Federation of Tax Administrators, American Petroleum Institute, Campaign for Tobacco-Free Kids, National Automobile Dealers Association, each state’s Department of Motor Vehicles and WalletHub research.
WalletHub experts are widely quoted. Contact our media team to schedule an interview.