
For more information on how electronic tiltmeters and GPS receivers help monitor the deformation of Kīlauea Volcano, see the HVO Deformation page.

Click image at right for larger map. Data plots from additional stations are available from our interactive map, which allows you to view different types of data (using the right-side menu on the map).
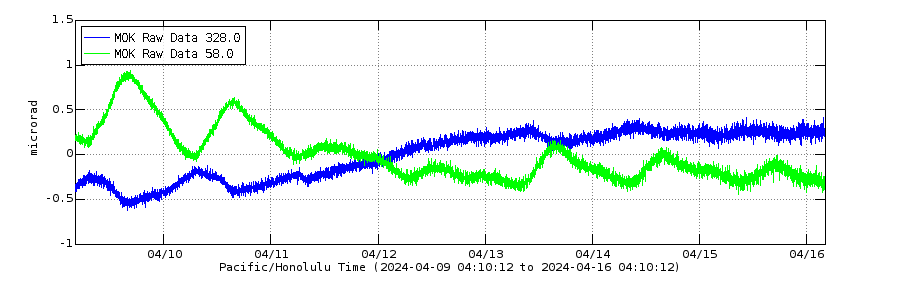
Electronic Tilt at Mauna Loa Summit - Past Week
Electronic Tilt at Mauna Loa Summit - Past Month
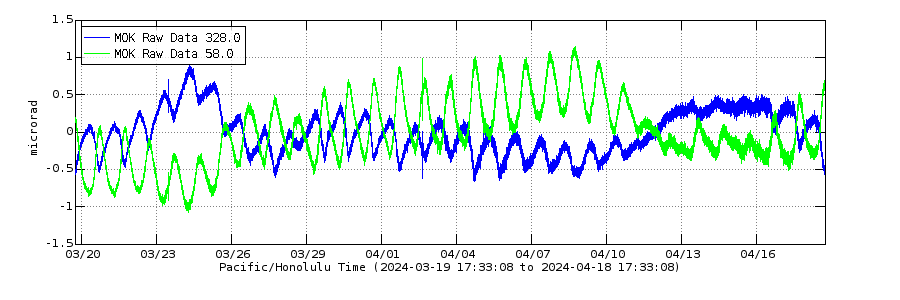
Above: Tilt data from a site near the northwest rim of Mauna Loa's summit caldera. The tiltmeter responds to daily and seasonal temperature fluctuations as well as possible changes in Mauna Loa's magma storage system.
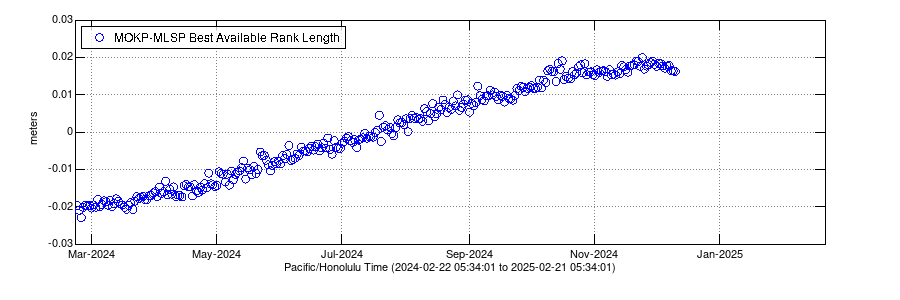
Global Positioning System - Cross-caldera Distance Change
Past Year
Past 5 Years

Above: Changes in distance between two GPS stations on opposite sides of Mokuʻāweoweo, Mauna Loa's summit caldera. Extension across the caldera is often an indication of inflation of the shallow summit magma reservoir.
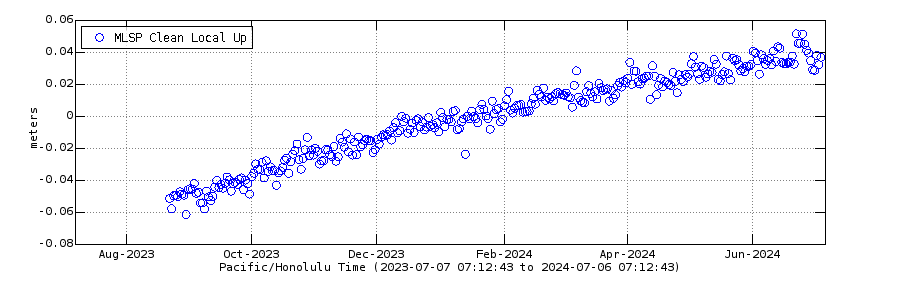
Global Positioning System - Summit Vertical Motion
Past Year
Past 5 Years
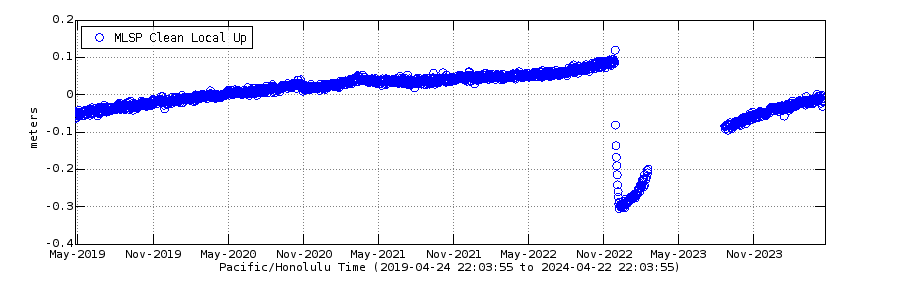
Above: Vertical motion of a GPS station on the southeast side of Mauna Loa's summit caldera. This station is in an area that has historically shown the largest amount of uplift with inflation.
Related Information
-
Past 5 Years Monitoring Data for Mauna Loa
Seismic and deformation monitoring data.Past Year Monitoring Data for Mauna Loa
Seismic and deformation monitoring data.Past Month Monitoring Data for Mauna Loa
Seismic and deformation monitoring data.Past Week Monitoring Data for Mauna Loa
Past week monitoring data for Mauna Loa.


Past Month Monitoring Data for Mauna Loa
Past Week Monitoring Data for Mauna Loa
Past Year Monitoring Data for Mauna Loa
Past 5 Years Monitoring Data for Mauna Loa
For more information on how electronic tiltmeters and GPS receivers help monitor the deformation of Kīlauea Volcano, see the HVO Deformation page.
Click image at right for larger map. Data plots from additional stations are available from our interactive map, which allows you to view different types of data (using the right-side menu on the map).
Electronic Tilt at Mauna Loa Summit - Past Week
Electronic Tilt at Mauna Loa Summit - Past Month
Above: Tilt data from a site near the northwest rim of Mauna Loa's summit caldera. The tiltmeter responds to daily and seasonal temperature fluctuations as well as possible changes in Mauna Loa's magma storage system.
Global Positioning System - Cross-caldera Distance Change
Past Year
Past 5 Years
Above: Changes in distance between two GPS stations on opposite sides of Mokuʻāweoweo, Mauna Loa's summit caldera. Extension across the caldera is often an indication of inflation of the shallow summit magma reservoir.
Global Positioning System - Summit Vertical Motion
Past Year
Past 5 Years
Above: Vertical motion of a GPS station on the southeast side of Mauna Loa's summit caldera. This station is in an area that has historically shown the largest amount of uplift with inflation.
Related Information
-
Past 5 Years Monitoring Data for Mauna Loa
Seismic and deformation monitoring data.Past Year Monitoring Data for Mauna Loa
Seismic and deformation monitoring data.Past Month Monitoring Data for Mauna Loa
Seismic and deformation monitoring data.Past Week Monitoring Data for Mauna Loa
Past week monitoring data for Mauna Loa.