Markets
Comparing the Speed of U.S. Interest Rate Hikes (1988-2022)
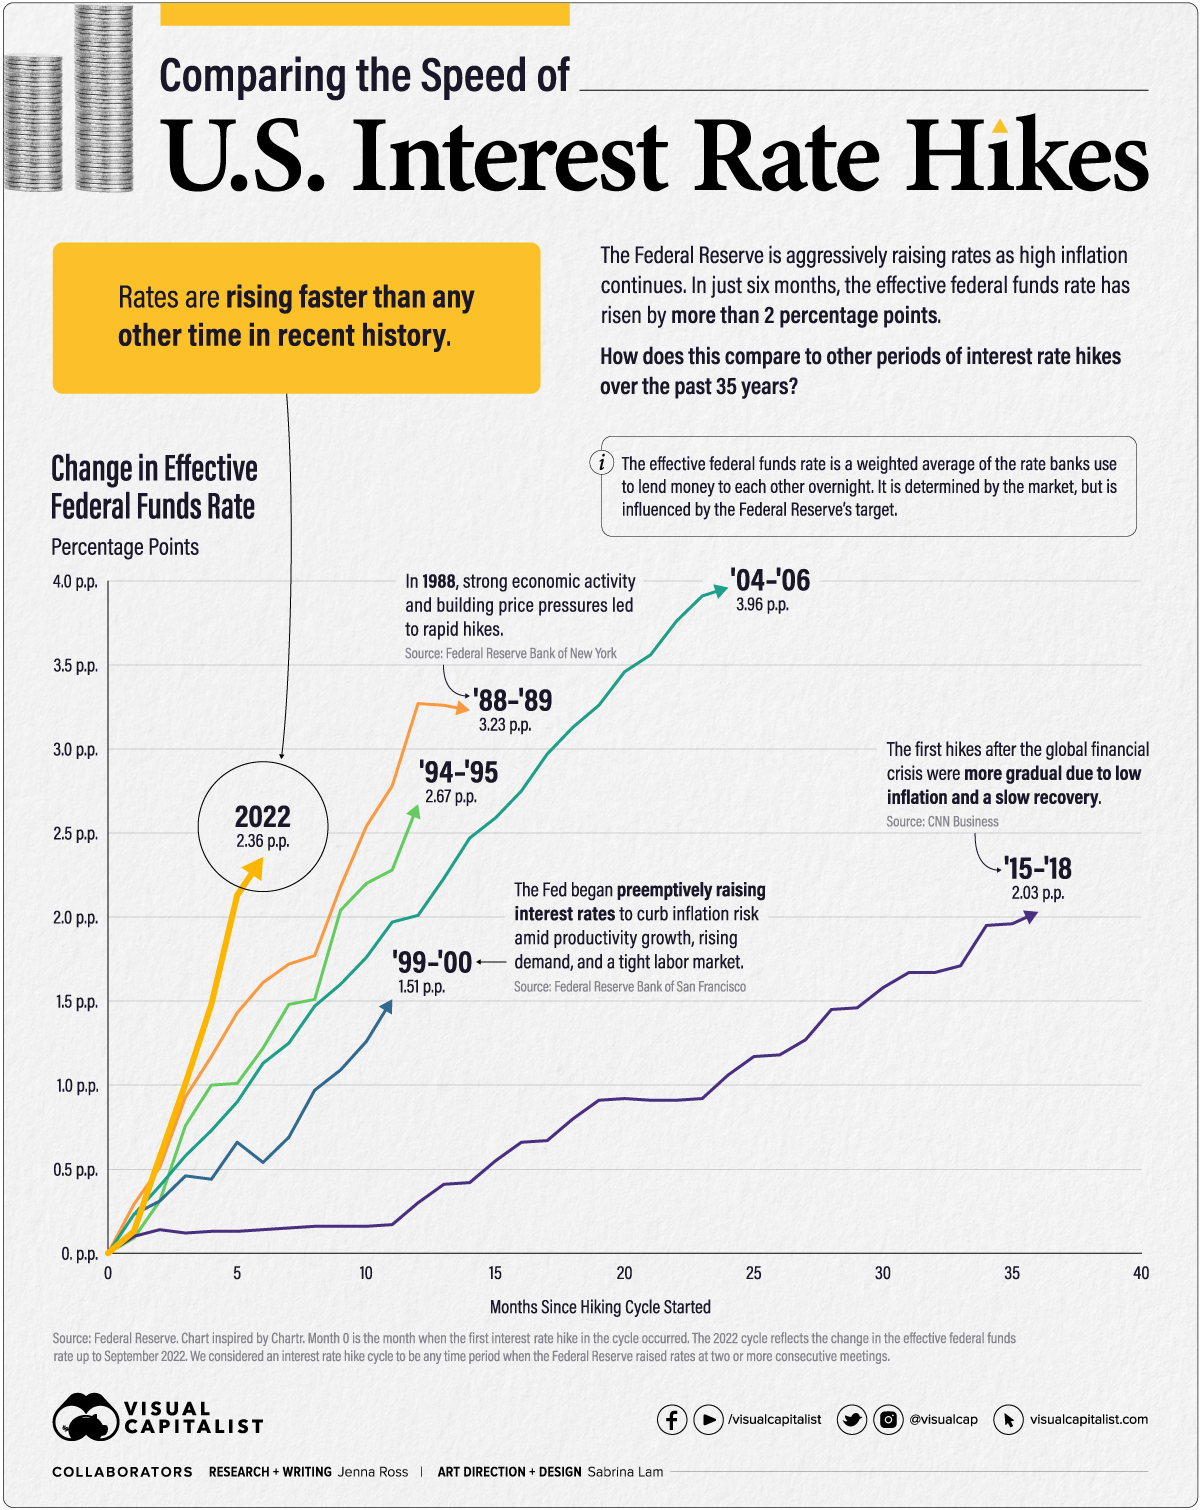


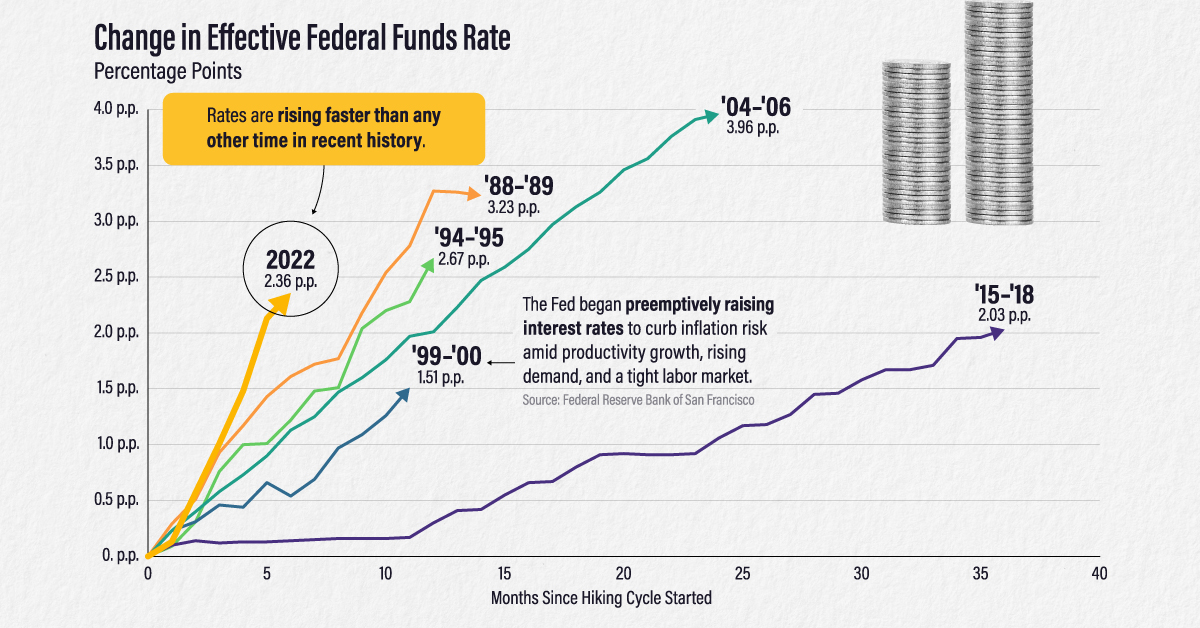
Comparing the Speed of U.S. Interest Rate Hikes
As U.S. inflation remains at multi-decade highs, the Federal Reserve has been aggressive with its interest rate hikes. In fact, rates have risen more than two percentage points in just six months.
In this graphic—which was inspired by a chart from Chartr—we compare the speed and severity of the current interest rate hikes to other periods of monetary tightening over the past 35 years.
Measuring Periods of Interest Rate Hikes
We used the effective federal funds rate (EFFR), which measures the weighted average of the rates that banks use to lend to each other overnight. It is determined by the market but influenced by the Fed’s target range. We considered the starting point for each cycle to be the EFFR during the month when the first rate hike took place.
Here is the duration and severity of each interest rate hike cycle since 1988.
| Time Period | Duration (Months) | Total Change in EFFR (Percentage Points) |
|---|---|---|
| Mar 1988 - May 1989 | 14 | 3.23 |
| Feb 1994 - Feb 1995 | 12 | 2.67 |
| Jun 1999 - May 2000 | 11 | 1.51 |
| Jun 2004 - Jun 2006 | 24 | 3.96 |
| Dec 2015 - Dec 2018 | 36 | 2.03 |
| Mar 2022 - Sep 2022 | 6 | 2.36 |
* We considered a rate hike cycle to be any time period when the Federal Reserve raised rates at two or more consecutive meetings. The 2022 rate hike cycle is ongoing with data as of September 2022.
The 2022 rate hike cycle is the fastest, reaching a 2.36 percentage point increase nearly twice as fast as the rate hike cycle of ‘88-‘89.
On the other hand, the most severe interest rate hikes occurred in the ‘04 – ‘06 cycle when the EFFR climbed by almost four percentage points. It took much longer to reach this level, however, with the hikes taking place over two years.
Timing Interest Rate Hikes
Why are 2022’s interest rate hikes so rapid? U.S. inflation far exceeds the Fed’s long-term target of 2%. In fact, when the hikes started in March 2022, inflation was the highest it’s ever been in the last six rate hike cycles.
| Time Period | Inflation Rate at Start of Cycle |
|---|---|
| Mar 1988 - May 1989 | 3.60% |
| Feb 1994 - Feb 1995 | 2.06% |
| Jun 1999 - May 2000 | 1.40% |
| Jun 2004 - Jun 2006 | 2.89% |
| Dec 2015 - Dec 2018 | 0.30% |
| Mar 2022 - Sep 2022 | 6.77% |
Inflation rate is the year-over-year change as measured by the Personal Consumption Expenditures (PCE) Index.
In contrast, three of the rate hike cycles started with inflation at or below the 2% target. Inflation was just 0.30% in December 2015 when the Fed announced its first rate hike since the global financial crisis.
Some criticized the Fed for raising rates prematurely, but the Fed’s rationale was that it can take up to three years or more for policy actions to affect economic conditions. By raising rates early and gradually, the Fed hoped to avoid surging inflation in the future.
Fast forward to today, and the picture couldn’t look more different. Inflation exceeded the 2% target for 12 months before the Fed began to raise rates. Initially, the Fed believed inflation was “transitory” or short-lived. Now, inflation is a top financial concern and there is a risk that it has gathered enough momentum that it will be difficult to bring down.
Balancing Inflation and Recession Risks
The Fed expects to raise its target rate to around 4.4% by the end of 2022, up from the current range of 3-3.25%. However, they don’t foresee inflation reaching their 2% target until 2025.
In the meantime, the rapid interest rate hikes could lead to an economic downturn. Risks of a global recession have increased as other central banks raise their rates too. The World Bank offers policymakers a number of suggestions to help avoid a recession:
- Central banks can communicate policy decisions clearly to secure inflation expectations and, hopefully, reduce how much they need to raise rates.
- Governments can carefully withdraw fiscal support, develop medium-term spending and tax policies, and provide targeted help to vulnerable households.
- Other economic policymakers can help relieve supply pressures through various measures. For instance, they can introduce policies to increase labor force participation, enhance global trade networks, and bring in measures to reduce energy consumption.
Will policymakers heed this advice and, if so, will it prove sufficient to avoid a global recession?


Markets
Mapped: Europe’s GDP Per Capita, by Country
Which European economies are richest on a GDP per capita basis? This map shows the results for 44 countries across the continent.


Mapped: Europe’s GDP Per Capita, by Country (2024)
This was originally posted on our Voronoi app. Download the app for free on iOS or Android and discover incredible data-driven charts from a variety of trusted sources.
Europe is home to some of the largest and most sophisticated economies in the world. But how do countries in the region compare with each other on a per capita productivity basis?
In this map, we show Europe’s GDP per capita levels across 44 nations in current U.S. dollars. Data for this visualization and article is sourced from the International Monetary Fund (IMF) via their DataMapper tool, updated April 2024.
Europe’s Richest and Poorest Nations, By GDP Per Capita
Luxembourg, Ireland, and Switzerland, lead the list of Europe’s richest nations by GDP per capita, all above $100,000.
| Rank | Country | GDP Per Capita (2024) |
|---|---|---|
| 1 | 🇱🇺 Luxembourg | $131,380 |
| 2 | 🇮🇪 Ireland | $106,060 |
| 3 | 🇨🇭 Switzerland | $105,670 |
| 4 | 🇳🇴 Norway | $94,660 |
| 5 | 🇮🇸 Iceland | $84,590 |
| 6 | 🇩🇰 Denmark | $68,900 |
| 7 | 🇳🇱 Netherlands | $63,750 |
| 8 | 🇸🇲 San Marino | $59,410 |
| 9 | 🇦🇹 Austria | $59,230 |
| 10 | 🇸🇪 Sweden | $58,530 |
| 11 | 🇧🇪 Belgium | $55,540 |
| 12 | 🇫🇮 Finland | $55,130 |
| 13 | 🇩🇪 Germany | $54,290 |
| 14 | 🇬🇧 UK | $51,070 |
| 15 | 🇫🇷 France | $47,360 |
| 16 | 🇦🇩 Andorra | $44,900 |
| 17 | 🇲🇹 Malta | $41,740 |
| 18 | 🇮🇹 Italy | $39,580 |
| 19 | 🇨🇾 Cyprus | $37,150 |
| 20 | 🇪🇸 Spain | $34,050 |
| 21 | 🇸🇮 Slovenia | $34,030 |
| 22 | 🇪🇪 Estonia | $31,850 |
| 23 | 🇨🇿 Czech Republic | $29,800 |
| 24 | 🇵🇹 Portugal | $28,970 |
| 25 | 🇱🇹 Lithuania | $28,410 |
| 26 | 🇸🇰 Slovakia | $25,930 |
| 27 | 🇱🇻 Latvia | $24,190 |
| 28 | 🇬🇷 Greece | $23,970 |
| 29 | 🇭🇺 Hungary | $23,320 |
| 30 | 🇵🇱 Poland | $23,010 |
| 31 | 🇭🇷 Croatia | $22,970 |
| 32 | 🇷🇴 Romania | $19,530 |
| 33 | 🇧🇬 Bulgaria | $16,940 |
| 34 | 🇷🇺 Russia | $14,390 |
| 35 | 🇹🇷 Türkiye | $12,760 |
| 36 | 🇲🇪 Montenegro | $12,650 |
| 37 | 🇷🇸 Serbia | $12,380 |
| 38 | 🇦🇱 Albania | $8,920 |
| 39 | 🇧🇦 Bosnia & Herzegovina | $8,420 |
| 40 | 🇲🇰 North Macedonia | $7,690 |
| 41 | 🇧🇾 Belarus | $7,560 |
| 42 | 🇲🇩 Moldova | $7,490 |
| 43 | 🇽🇰 Kosovo | $6,390 |
| 44 | 🇺🇦 Ukraine | $5,660 |
| N/A | 🇪🇺 EU Average | $44,200 |
Note: Figures are rounded.
Three Nordic countries (Norway, Iceland, Denmark) also place highly, between $70,000-90,000. Other Nordic peers, Sweden and Finland rank just outside the top 10, between $55,000-60,000.
Meanwhile, Europe’s biggest economies in absolute terms, Germany, UK, and France, rank closer to the middle of the top 20, with GDP per capitas around $50,000.
Finally, at the end of the scale, Eastern Europe as a whole tends to have much lower per capita GDPs. In that group, Ukraine ranks last, at $5,660.
A Closer Look at Ukraine
For a broader comparison, Ukraine’s per capita GDP is similar to Iran ($5,310), El Salvador ($5,540), and Guatemala ($5,680).
According to experts, Ukraine’s economy has historically underperformed to expectations. After the fall of the Berlin Wall, the economy contracted for five straight years. Its transition to a Western, liberalized economic structure was overshadowed by widespread corruption, a limited taxpool, and few revenue sources.
Politically, its transformation from authoritarian regime to civil democracy has proved difficult, especially when it comes to institution building.
Finally, after the 2022 invasion of the country, Ukraine’s GDP contracted by 30% in a single year—the largest loss since independence. Large scale emigration—to the tune of six million refugees—is also playing a role.
Despite these challenges, the country’s economic growth has somewhat stabilized while fighting continues.

-

 Politics5 days ago
Charted: What Southeast Asia Thinks About China & the U.S.
-

 Misc2 weeks ago
Visualizing the Most Common Pets in the U.S.
-

 Culture2 weeks ago
The World’s Top Media Franchises by All-Time Revenue
-

 Best of2 weeks ago
Best Visualizations of April on the Voronoi App
-

 Wealth1 week ago
Charted: Which Country Has the Most Billionaires in 2024?
-

 Markets1 week ago
The Top Private Equity Firms by Country
-

 Markets1 week ago
The Best U.S. Companies to Work for According to LinkedIn
-

 Economy1 week ago
Ranked: The Top 20 Countries in Debt to China