California’s community water systems distribute water to homes and businesses.
- On average, 10% of the state’s water goes to communities. More than 400 large, urban water utilities supply water to over 90% of California’s residents, and nearly 2,500 smaller utilities serve more rural communities. Tens of thousands of rural homes get their water from domestic wells.
- Most community water systems rely on surface and groundwater for their supplies; desalination and recycled water are less common. Smaller (and especially rural) systems typically rely exclusively on groundwater.
- Surface water availability declines during drought and sometimes is conveyed long distances. Groundwater is more available during droughts, but overpumping can threaten wells in unmanaged basins.
Statewide, per-capita water use has fallen considerably over the last two decades.
- Total water use by communities—also known as urban water use—grew steadily until the 1990s. It has since plateaued, even though California’s population grew by 5.5 million people from 2000–20.
- Per-capita water use tends to be higher in inland areas than on the coast due, in part, to higher temperatures and larger yards. Yet inland residents have made the biggest strides in reducing water use.
- When water-saving practices adopted during drought end, per-capita use may rebound. An uptick in per-capita use occurred after the 2012–16 drought, but overall use remains on a downward trajectory.
Per-capita urban water use rebounded slightly after the last drought, but continues to decline overall
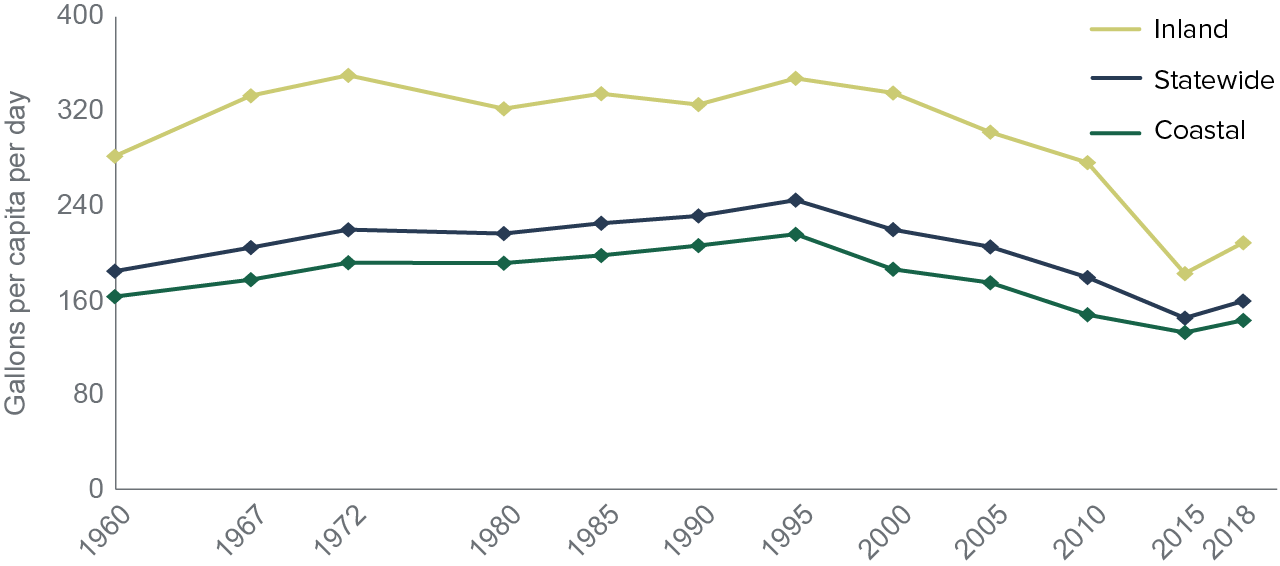
SOURCE: Author calculations using data from the California Department of Water Resources, California Water Plan Update (various years).
NOTES: The figure shows “applied” water delivered to homes and businesses in a water year (October to September). “Net” water use—i.e., the volume consumed by people or plants, embodied in manufactured goods, evaporated, or discharged to saline waters—is lower. Totals exclude water used by power plants and groundwater recharge projects and water lost during conveyance. Inland areas tend to have higher per-capita use due to higher temperatures and larger landscaped areas. Pre-2000 estimates are adjusted to levels for a year of normal rainfall. Except for 2015 (a critically dry year), estimates from 2000 onward are for actual use in years with near-normal precipitation.
Drought and climate change are prompting cities to invest in supply resilience.
- Larger utilities have been investing in conservation, storage, new supplies, and interconnections with other utilities to improve drought resilience and adapt to the changing climate. As costs grow, so does the challenge of keeping rates affordable.
- Population growth, coupled with new groundwater restrictions under the Sustainable Groundwater Management Act, could squeeze systems that rely on groundwater. This is especially true in the San Joaquin Valley, a fast-growing region with significant groundwater overdraft.
- Some utilities are exploring new ways to enhance supply reliability by partnering with agricultural districts and expanding storage in groundwater banks.
Urban utilities have embraced conservation.
- Addressing leaks and updating household fixtures have brought large gains in urban water conservation. But advances in long-term efficiency can make it harder to reduce water use during drought emergencies.
- During the 2012–16 drought, average statewide water savings reached nearly 25%, and many of those savings stuck. In the 2020–22 drought, many agencies had less room to make further reductions.
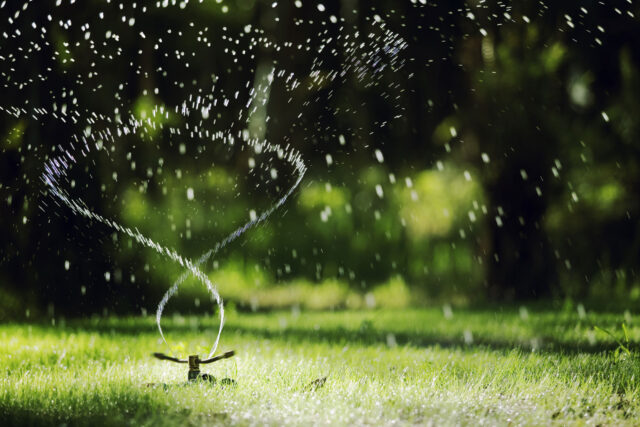
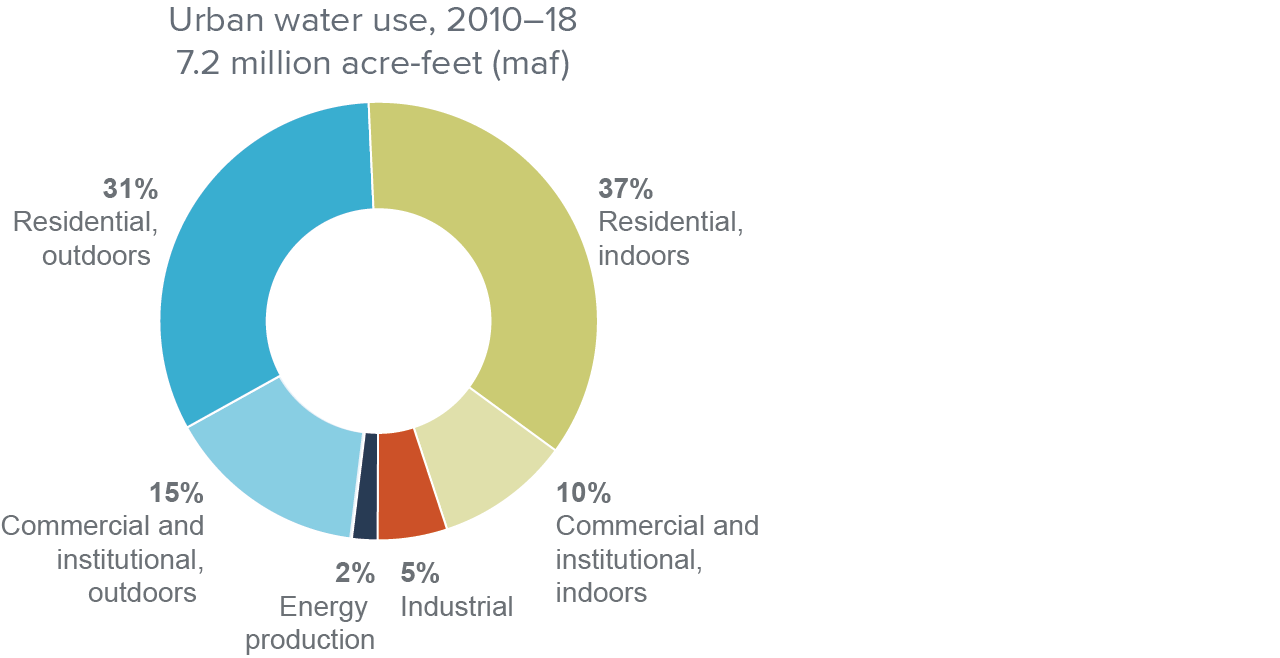
- Outdoor water use continues to consume roughly half of total urban water; reducing outdoor use presents one of the biggest opportunities for further cost-effective urban conservation.
Landscaping accounts for roughly half of total urban water use
SOURCE: California Department of Water Resources.
NOTES: The figure shows the average “applied” urban water use, as defined in the notes to the preceding figure. Data for 2017 were not available. “Net” urban water use (also defined above) was lower (4.7 maf). Commercial and institutional outdoor use is the sum of official estimates for “large landscapes” (parks, golf courses, etc.) and one-third of the total estimate for commercial and institutional use, which includes other outdoor water use.
Small, rural systems face greater challenges maintaining safe and resilient supplies.
- While larger utilities can spread infrastructure costs over a wide customer base, small, isolated systems incur high costs per customer. Small systems find it harder to build drought resilience and to comply with water quality regulations, which often require costly treatment.
- Groundwater contaminants such as nitrate and arsenic can cause major problems for smaller water systems, while others like perchlorate have required costly efforts from small and large utilities alike. State and federal programs have recently increased technical and financial support to address these issues.
- Consolidation and partnerships can help small communities reap the benefits of scale. For example, some northern San Joaquin Valley communities are jointly developing surface water conveyance and treatment to diversify their supply portfolios.
Topics
Safe Drinking Water Water, Land & Air