|
The US National Library of Medicine, National Institutes of Health recently published an article stating: COVID-19 Is a Data Science Issue. The GIS community has felt this “issue” first hand. Unlike other disaster events, where data streams are known and even pre-planned, the COVID-19 response has included particularly messy data, with known inaccuracies. Yet, everyone—from government leaders, to the public, to the press, continue to demand or expect precise numbers from this imperfect data set.
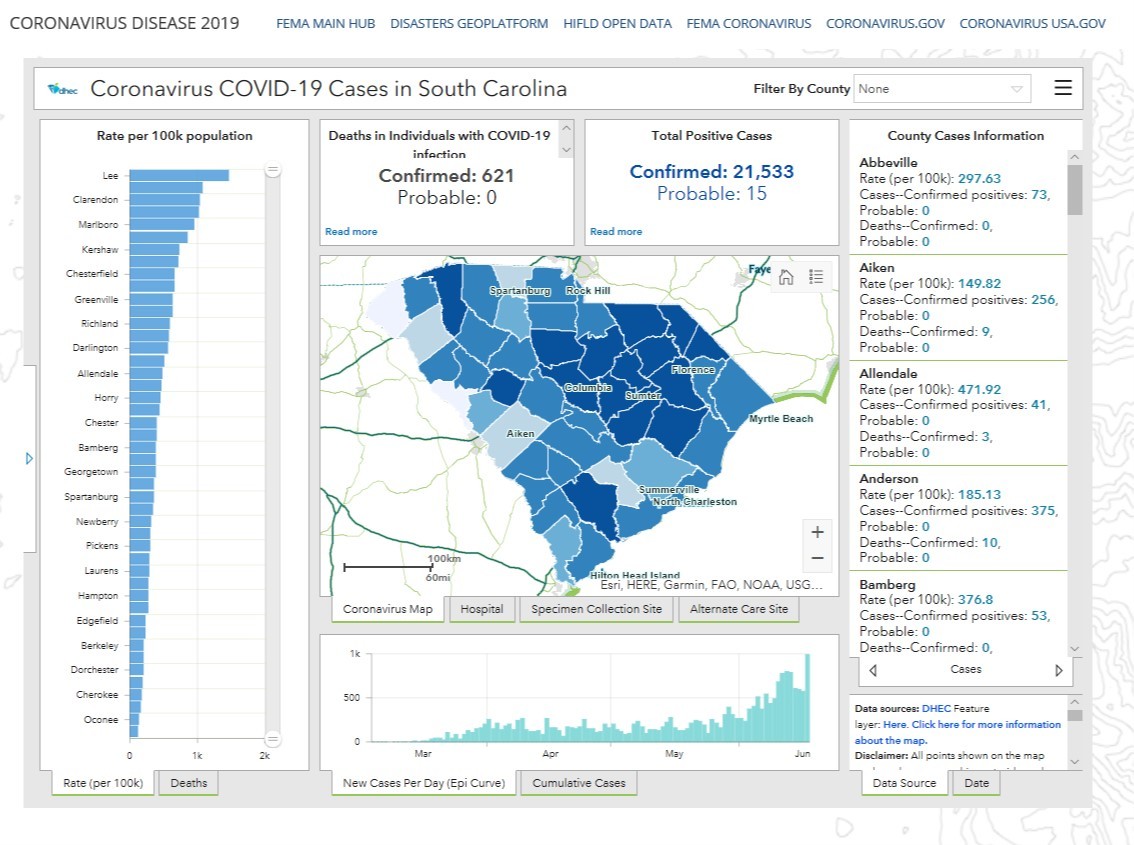
We spoke this week with Veronica Moore, the GIS Program Manager in the South Carolina Department of Health & Environmental Control, and asked her about some of the lessons she and her team learned during this response and how they coped with data management. (See their dashboard below.) The biggest takeaways—the need for centralized data that is shared through a REST Service for internal consumption, and the need to provide it in a consumable format for the public and stakeholders.
 PDFs Are Not the Best Method for Sharing Data
At the beginning of the event, Moore described how some organizations stored their data in spreadsheets and shared the content with other state agencies via a pdf. This became problematic when data points changed and people still referred to downloaded and outdated documents. She used the example of changes to the death total by zip code. The health department will adjust these numbers, if necessary, after they conduct an investigation to match a death certificate to the person’s home versus the zip code of the hospital where they died. However, once the changes are made, leaders with outdated spreadsheets can be frustrated by seemingly disparate numbers.
To address this issue, Moore and her team introduced REST services. She admits that at first, she did have to help some folks understand what a REST service was, and had to help them break out of their comfort zone. But, she states it was worth it because: “If you have centralized data then you have won the battle.” She and her team work to streamline data workflows and update the data on the back end, and then provide it in a consumable format so others can use it to “...tell their own story. That is where the power is.”
Build Relationships
Moore also emphasized the importance of building relationships with emergency partners, including with the cities and counties, and the need to understand their perspective. The Charleston hub page is a great example of how local governments provide their citizens community-specific information. Their site even includes a map of open public restrooms and handwashing stations. “They have a need for different kinds of analysis at the local level. We worked to both empower them and understand their requirements. Now, everyone has come to a point where workflows have been developed and we are progressing.”
|
Ensure Your Data is Consumable
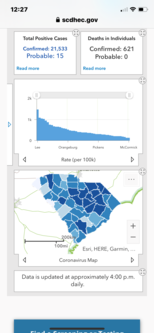
Similar to our interview with the state of Texas last week, Moore emphasized the need to provide information in a mobile friendly format (see screenshot). She noted that the ability for their stakeholders to view the content on a mobile device “was a game changer.”
Thank you Veronica for your insights. Should anyone have questions for her or her team please reach out to her at mooreve@dhec.sc.gov.
|
|
 |
View the South Carolina maps and apps, as well as more than 500 other pieces of content from our state, regional and NGO partners in FEMA's COVID-19 Geospatial Resource Center.
|