Characterizing the weather band variability of the Texas shelf current
 Uchenna C. Nwankwo1,2*
  Steven F. DiMarco1,3
  Heather M. Nowak4 Kerri Whilden5 Brian Buckingham6 John Walpert1
  Anthony H. Knap1,3
- 1Geochemical and Environmental Research Group, Texas A&M University, College Station, TX, United States
- 2Energy and Infrastructure Division, Gulf of Mexico Coastal Ocean Observing System, College Station, TX, United States
- 3Department of Oceanography, Texas A&M University, College Station, TX, United States
- 4Woods Hole Group, Houston, TX, United States
- 5Department of Marine and Coastal Science, Fugro, Houston, TX, United States
- 6Department of Marine and Coastal Sciences, Rutgers University, New Brunswick, NJ, United States
Considering the benefits of understanding the circulation patterns of the shelf, it is not surprising that there are numerous studies of the Texas Shelf circulation patterns. Given that previous studies were focused on the low-frequency variability of the circulation which is upcoast (northeast flow) in the summer and downcoast (southwest flow) especially on the inner shelf in the non-summer seasons, this study investigates the weather band (2–15 days) variability of the Texas Shelf near-surface circulation pattern. Current meter data at 1.5 m below the sea surface from the inner, mid, and outer shelves were analyzed. This study demonstrated that there are high-frequency current reversals within the weather band in each season. From the estimated persistence of the currents during reversals, the inner and mid shelf currents are predominantly downcoast in the non-summer seasons and upcoast in the summer season whereas the outer shelf currents are mostly upcoast all year round. The Wavelets analysis of the currents revealed that most of the variabilities on the inner and mid shelf regions were within the 4-12-day band whereas on the outer shelf the dominant variability was within the 3–8-day band. From the cross-spectra analysis of both the currents and wind data, it was determined that the influence of the wind was more dominant on the inner and mid shelf regions at the 8–15-day band than on the outer shelf where the contribution of the wind is prevalent at the 2–4-day band.
Introduction
The Texas–Louisiana shelf is one of the most well-studied shelves in the Gulf of Mexico primarily due to the influence by numerous physical processes, which includes but is not limited to freshwater discharge, wind, Loop Current eddies, and other mesoscale cyclonic and anticyclonic anomalies (Nowlin et al., 2005; Schmitz et al., 2005; Bianchi et al., 2010). Based on the resultant contributions of these processes, there are predominantly two specific current patterns within the inner shelf. The Louisiana Coastal Current flows along the Louisiana coast, and it is mainly driven by buoyancy fluxes resulting from the mixing of freshwater due to the Mississippi River and Atchafalaya River discharge and inner shelf seawater (Li et al., 1996; Etter et al., 2004). Unlike the Louisiana Coastal Current, the buoyancy forcing due to the Mississippi and Atchafalaya Rivers plays a secondary role in Texas Coastal Current and the current thrives mainly on the Texas coast (Oey, 1995).
Using short (time series <3 years) records of current and hydrographic data, Cochrane and Kelly (1986, hereafter CK86) provided a general description of the low-frequency (i.e., seasonal) Texas Coastal Current from estimated fields of geopotential. The field data showed that in the non-summer months, a cyclonic gyre is present on the Texas–Louisiana shelf. Over this period, a downcoast (southwest) flow was observed on the inner shelf (depth <50 m) of the Texas–Louisiana shelf, whereas in the summer season an anticyclonic gyre replaces the cyclonic gyre as such, resulting in an upcoast (northeast) flow on the inner shelf. CK86 attributes the inner shelf flow pattern to the along-shore component of the wind stress.
The influence of wind stress on the inner shelf low-frequency current variability has been reported by others. Cho et al. (1998) estimated a significant positive correlation coefficient between the along-shore wind stress coefficient and the mode 1 principle component of the stream function field. Both Oey (1995) and Li et al. (1996) confirmed that wind is the primary mechanism responsible for the inner shelf flow.
In addition to the contribution of low-frequency wind forcing to the Texas Coastal Currents, high-frequency processes such as frontal passages also contribute to the coastal current. Frontal passage especially during the non-summer months result in the change in the magnitude and direction of the along-shore component of coastal currents (Smith, 1978). Variability of shelf currents at near inertial and tidal time scales (i.e., order of 24 h) has also been observed and reported (Daddio et al., 1978; Chen et al., 1996; DiMarco and Reid, 1998; DiMarco et al., 2000; Zhang et al., 2009; Zhang et al., 2010). Dzwonkowski et al. (2015) reported similar contributions of frontal passages on the Mississippi–Alabama inner shelf.
On the Texas outer shelf, the flow is predominantly driven by mesoscale features. Cho et al. (1998) showed that on the outer shelf, the contributions of Loop Current eddies to the low-frequency flow variability supersede the influence of wind stress. Nowlin et al. (2005) and Hamilton (1992) corroborated this and added that other mesoscale cyclonic and anticyclonic formations derived from current–topographic interaction and eddy–eddy interaction may also influence the outer shelf flow.
Most of the previous studies on the Texas shelf currents have been focused on long-period (period >1 month) variability, which led to the reports of the low-frequency Texas Coastal current pattern. The goal of the study reported here is to determine the spatial and temporal differences in the frequency and duration of the near-surface current reversals on the Texas shelf as well as to characterize the interannual and seasonal variability of these current reversals with emphasis on the weather band (2–15-day periods) high-frequency current reversals. Results of this study can be useful to inform engineering decisions regarding the structural strength and design of offshore platforms, which are subjected to different magnitudes of stress from the ocean current. Additionally, quantification of the temporal and spatial variability of the Texas shelf current within the weather band is important for the response and mitigation of coastal hazards such as oil and chemical spills, harmful algal bloom, and hypoxia.
Data and method
Data sources
The majority of the data used in this study were obtained from the Texas Automated Buoy System (TABS). TABS is supported by The Texas General Land Office (TGLO) and operated and maintained by the Geochemical and Environmental Research Group (GERG) of the Texas A&M University. According to Walpert et al. (2011), a total of 19 buoys have been deployed since the inception of TABS and most of the buoys were deployed on the inner (15 km from the coast) and outer Texas Shelf (up to 185 km from the coast). TABS buoys record water temperature, salinity, and 5-min vector-averaged current velocity at ~1.8 m below the water surface (Kelly et al., 1998). All datasets’ sample interval is 30 min. Recent and historical datasets from the buoys are available on the TABS webpage (http://tabs.gerg.tamu.edu/tglo), GCOOS website (https://data.gcoos.org), and National Data Buoy Center’s (NDBC) website (http://ndbc.noaa.gov). Presently, TABS consists of eight fully operational buoys.
Current velocity data analyzed in this study were from nine buoys, collected from current meters at 1.5 m below the surface (near surface current) and covering the time period 1995 to 2013. Over this time period, data from the remaining 10 buoys were considerably too short as they were decommissioned after short periods of operation. Figure 1 in the Appendix shows the length and data availability of the current velocity time series from the buoys. It is immediately obvious that the differences in buoy deployment resulted in the variabilities of the time series length. Also, the percentage of data availability shown on the y-axis varied between the buoys and it ranges from 68% (Buoy K) to 93% (Buoy B).
In addition to the current velocity data, wind data were also analyzed in this study. Some of the TABS buoys were equipped with anemometers, and this would have enhanced a collocated wind and current comparisons. However, the presence of erroneous data resulted in numerous data gaps, which hindered analysis. As such, the wind data were instead obtained from the NDBC buoy with relatively longer continuous data in the vicinity of a TABS buoy. The choice of NDBC wind station was based on the proximity to the TABS buoy and length of continuous data. Consequently, the selected wind stations were not necessarily closest to the TABS compared but had the longest length of continuous data over the corresponding period in the current data. Additionally, the minimum period of continuous data considered is 1 year. Based on these constraints, PTAT2, 42020, and SRST2 (red stars, Figure 1) were selected and they corresponded to TABS buoys D, K, and R, respectively. The sampling interval for the NDBC wind data were at 1-hourly intervals.
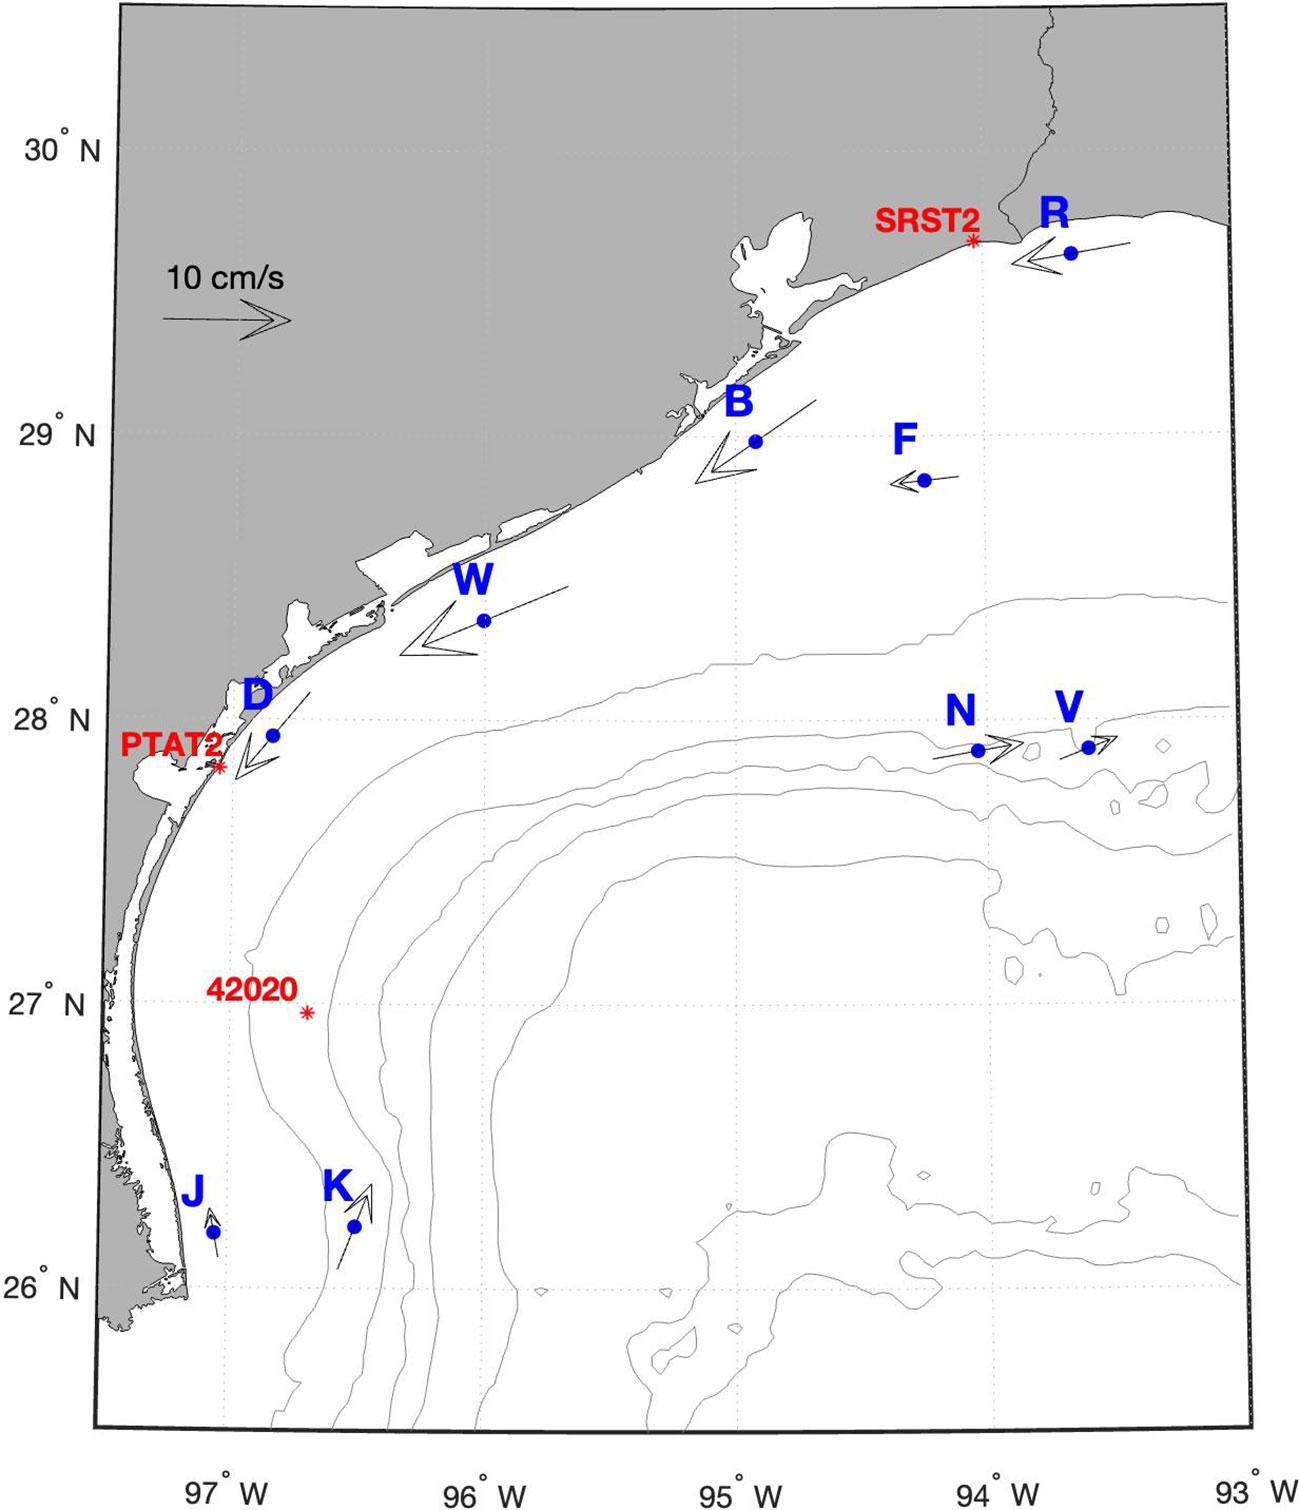
Figure 1 Map of the locations of the wind (red stars) and TABS buoys used in the study as well as the mean currents. Shown are 50-, 100-, 200-, 500-, 1,000-, 2,000-, and 3,000-m isobaths.
Data processing and analyses
Adopting the filtering technique described in Nwankwo et al. (2023), both the wind and current velocity data were filtered using a 40-h lowpass window. This ensured that the contributions from processes such as tides, sea breeze, and inertial oscillations whose periods are less than 2 days were reduced.
Considering the geographical orientation of the local isobath at the buoy locations, the current and wind vectors were rotated into along-shelf and cross-shelf vector components. The required angles used for the respective rotations of the vectors were determined by first estimating eigen vectors of the covariance matrix of the filtered u and v current velocity at each of the TABS buoy location (Thomson and Emery, 2014, 3rd Edition). The angle of the semi-major axis with respect to the x-axis was assumed to be the required angle as it approximated the angle of the isobath with respect to the coordinate system. Using the angle, the wind and filtered current velocity data were rotated transforming the vectors so that the semi-major axis aligned with the x-axis (positive toward the east), whereas the semi-minor axis aligned with the y-axis (positive toward the north). Rotation angles estimated at buoys D, K, and R were respectively applied to wind data from stations PTAT2, 42020, and SRST2. Hereinafter, upcoast flow (i.e., toward Louisiana) refers to positive u, downcoast flow refers to negative u, onshore flow refers to positive v, and offshore flow refers to negative v.
Using the rotated current timeseries, seasonal analysis of the current reversals and the persistence of the reversal were determined. The length of the analyzed timeseries for a given season must be greater than 60% of the seasonal period. In this study, a positive reversal corresponds to change from a downcoast flow to an upcoast flow for magnitudes greater than +1 cm s−1, whereas a negative reversal corresponds to a change from an upcoast flow to a downcoast flow for magnitudes greater than −1 cm s−1. Once a reversal was determined, the persistence of the reversal was estimated by computing the durations of the individual velocity class magnitudes within the upcoast/downcoast flow. The velocity class magnitudes were at 10-cm s−1 intervals from 0 to 100 cm s−1 then a single class for magnitudes greater than 100 cm s−1, and the durations range from less than 2 to 15 days at daily intervals. Persistence and reversal were not estimated in the section of a timeseries when the duration of the reversal was less than 24 h.
Following the estimation of upcoast/downcoast reversal alongside the associated persistence, statistical and spectral analyses were employed to characterize the interannual and seasonal variability within the weather band of the Texas shelf current. Daily means of both the current and wind data were computed resulting in daily timeseries. Using the daily timeseries, daily climatology of the current and wind data were estimated. Spatial variability of the climatology between stations was estimated by determining the correlation coefficient at the 95% confidence level. Anomalies with respect to the climatology were computed for every station (TABS and wind stations). However, only stations D, K, and R were used in the remainder of the analysis because there was a window when the length of continuous data that corresponded in time with wind data was greater than 1 year. Temporal variability of the energy within the weather band was estimated using wavelet analysis. Following CK86, the relationship between current and wind at the three TABS buoy locations were estimated from cross-spectral analysis.
Results
Mean current velocity
Mean velocity at the stations was computed from the filtered and unrotated current vectors (Figure 1), whereas Table 1 shows the statistical quantities of the rotated current vectors. The standard error of the mean was computed following Nowlin et al. (2005). All the vectors shown in Figure 1 were statistically significant as the mean velocities were greater than the corresponding standard error. However, some of the mean velocity components reported in Table 1 were not statistically significant and were represented in bold. Other than buoy J, all the vectors in-shore of the 50-m isobath tended downcoast (toward the Mexican border) (Table 1 Total timeseries). However, all the vectors offshore of the 50-m isobath tend upcoast (eastward and toward the Louisiana Shelf) (Table 1 Total timeseries). Furthermore, the vectors were mostly aligned along the isobaths (Figure 1), which indicated that along-shore flow dominates over across-shore flow. Additionally, the along-shore flow was also more variable than the across-shore flow. The magnitudes of the mean across-shore component at all the buoy locations excluding buoys K, N, V, and W were less than 1 cm s−1. Across-shore flow was toward the shore at all the buoy locations except B, D, and K. Table 1 further shows the seasonal variabilities at some of the stations as it shows that there were similarities between the non-summer and total timeseries. However, the pattern observed during the summer timeseries suggests that the flow on the entire Texas shelf was upcoast.
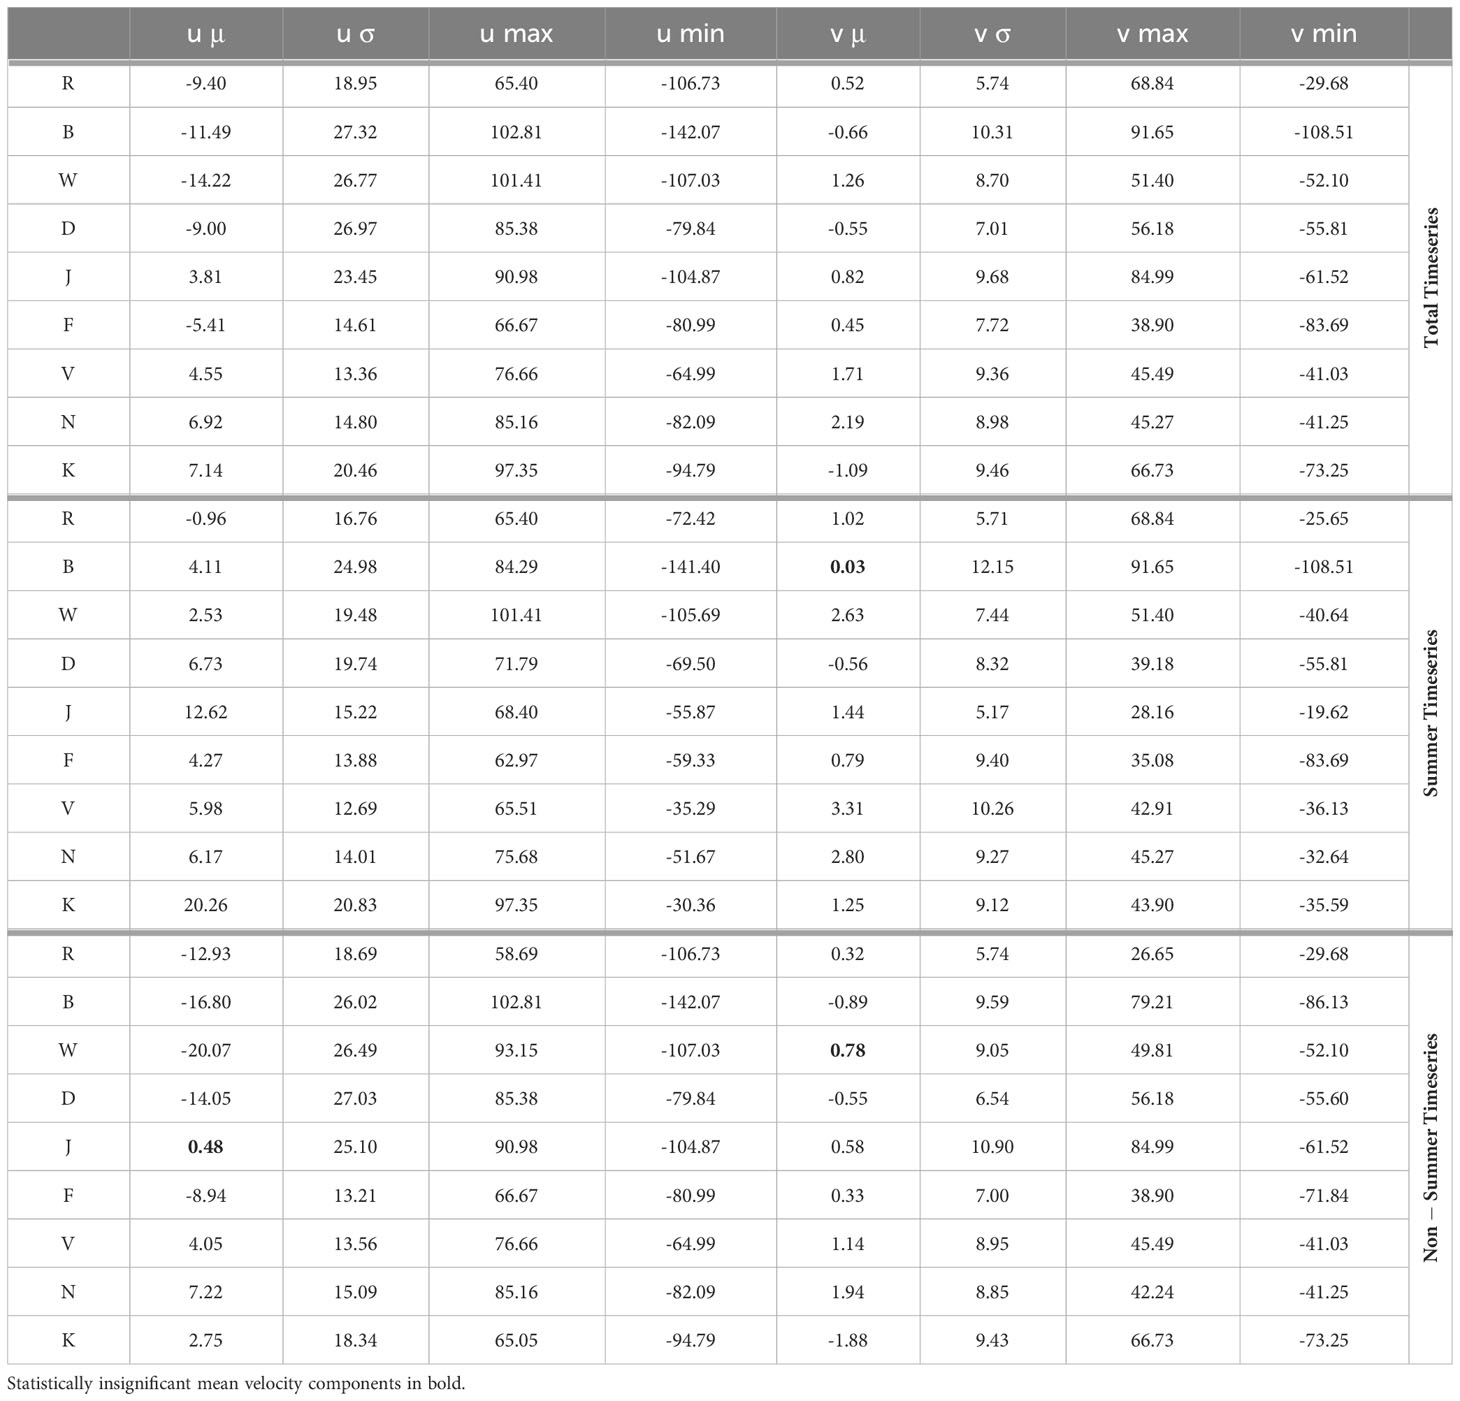
Table 1 Statistics (mean, standard deviation, maximum, and minimum) of the filtered velocity components [cm s–1] for the entire timeseries, summer timeseries and non-summer timeseries.
Spatiotemporal variability in current persistence, class, and reversal
Details of the seasonal variabilities in the upcoast/downcoast flow at all the buoy locations are shown in Figure 2. The four quadrants in each polar plot represents the four seasons where the first quadrant corresponds to the spring season and the fourth quadrant in the counterclockwise direction corresponds to the winter season. Each quadrant was normalized to 100% and divided into two equal halves at a 45° angle. Both persistence (plotted as percentage of downcoast duration) and number of reversals for each season of the year were represented on each quadrant. Plots on the lower half of each quadrant signify that the upcoast duration was greater than the downcoast duration and the dominance of the upcoast/downcoast persistence is represented by the varied sizes of the dots, and the corresponding color [upcoast (red) and downcoast (blue)]. Plots closer to the origin denotes fewer number of reversals for a given season.
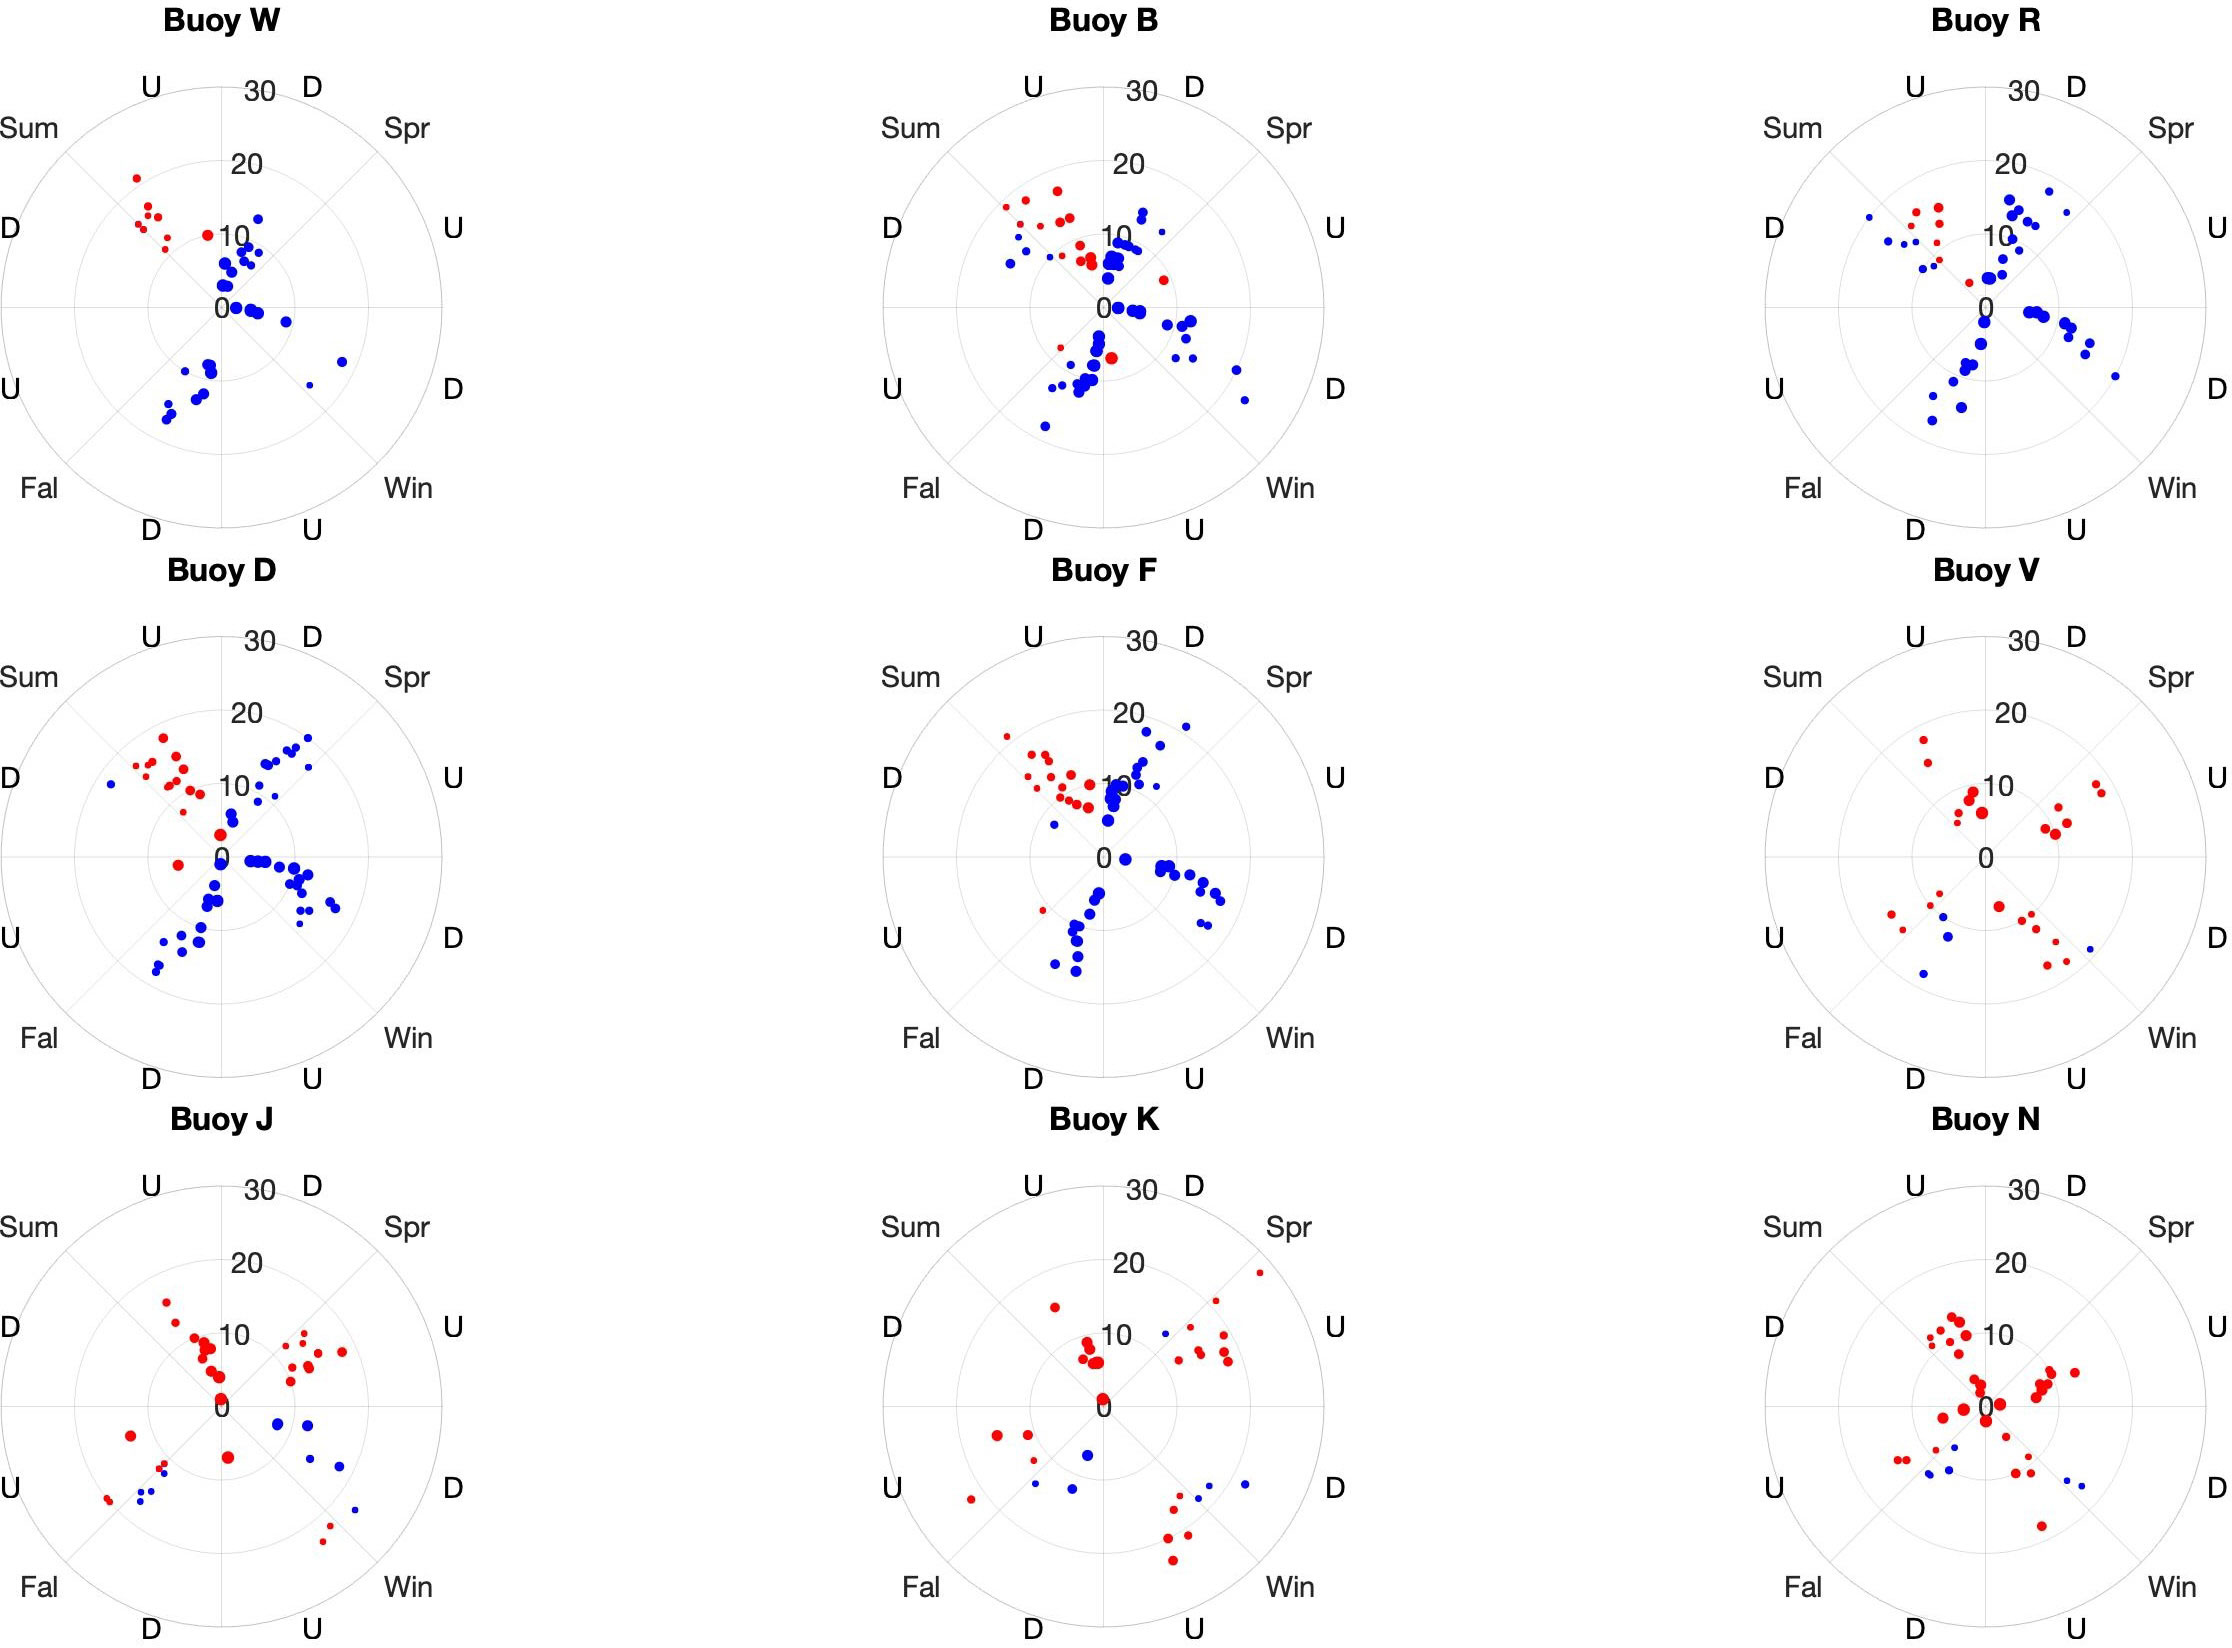
Figure 2 Seasonal persistence [downcoast (red dots) and upcoast (blue dots)] and reversals at the nine TABS locations. Each quadrant represents a season, and every quadrant is divided into two equal halves where the most persistent upcoast or downcoast flow is represented on the respective upper (downcoast) or lower (upcoast) half of the quadrant using a dot (.). The relative size of the dot depends on the proportion at which the upcoast (red) and downcoast (blue) flows dominate each other, while the distance of the respective dots from the origin indicates the number of reversals.
There were notable seasonal differences in the persistence estimated at the buoy locations. Downcoast flow was more persistent than the upcoast flow at most of the inner shelf buoys (B, D, F, R, and W) for the spring, fall, and winter seasons. This was not consistent over the entire timeseries as in some years, upcoast duration prevailed. While the upcoast flow was more persistent in the summer season at these buoy locations, there were also years when the duration of downcoast flow was greater than the upcoast flow duration especially at buoys B and R. The persistence at buoy J was visibly different from the other inner shelf buoys. Over the time period considered at buoy J, the upcoast flow was more persistent in the spring and summer seasons whereas the downcoast flow was more persistent in the fall and winter seasons. However, there were years when the duration of upcoast flow superseded the duration of the downcoast flow in the fall and winter seasons. Persistence determined at the offshore buoy (K, N, and V) locations were similar. Upcoast flow prevailed in spring and summer seasons for all years. Although there were instances when the persistence of downcoast flow prevailed in fall and winter seasons, there were more instances of upcoast flow in fall and winter seasons over the years.
Variabilities in the persistence of the velocity classes for the entire timeseries at all the buoy locations are shown in Figure 3. The total number of instances of each velocity class within a persistent duration was computed. The percentage of each velocity class number of occurrence with respect to the total number of occurrences of all velocity classes for a given persistent duration was also estimated. Although at different proportions, all the velocity classes were persistent within the 48-h persistent duration at most of the inner shelf buoys (B, J, R, and W) (Figure 3). Over this persistence period, at least 80% of the velocity classes are within the first three velocity classes at buoy F and all outer shelf buoys. At the other buoy locations, the first three velocity classes comprised 60% or more of the velocity classes in the 48-h period. As the duration of persistence increased, the number of velocity classes decreased as well as the likelihood of higher magnitude velocity classes. There were instances where no velocity class was recorded especially at higher persistence durations. In general, the first velocity class has the tendency to persist over longer durations when compared with other velocity classes. However, there were few cases of longer persistence as >94% (not shown) of the determined persistence for each velocity class was within 48-h period.
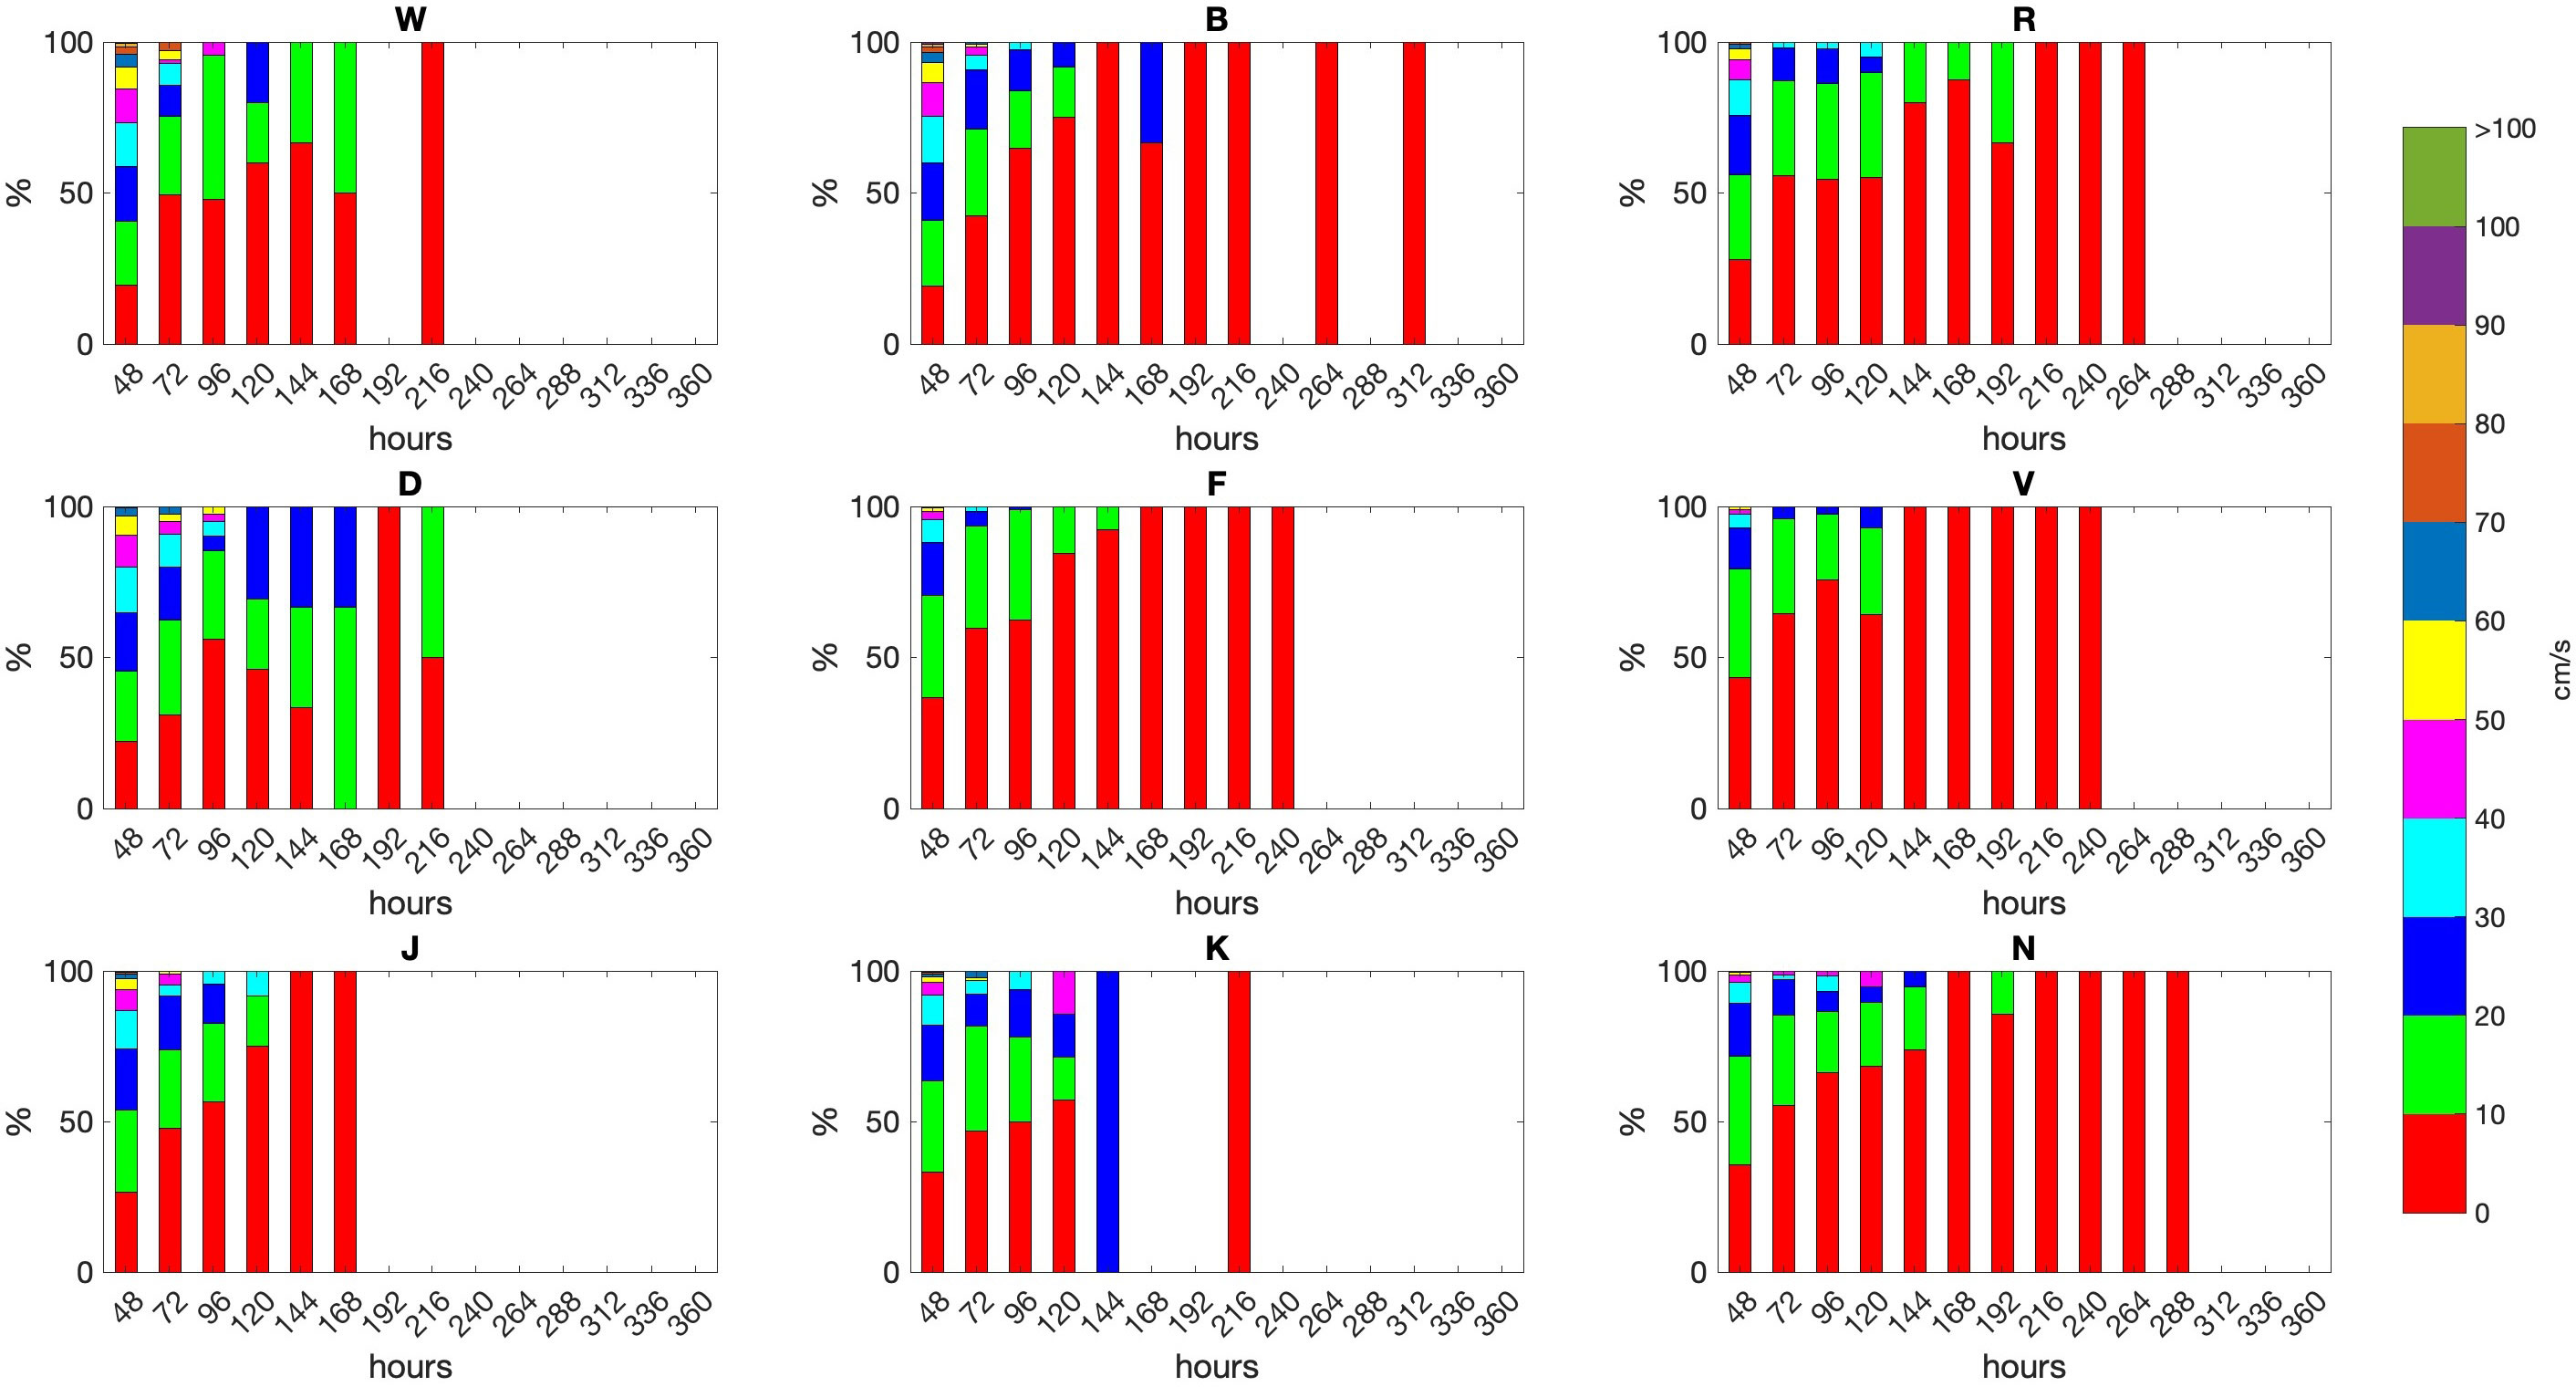
Figure 3 Proportion of velocity class and durations at the nine TABS locations.
Both temporal and spatial variabilities were observed in the number of reversals at the buoy locations. Although the number of reversals at the inner shelf buoy locations was clustered within 0 and 20 reversals, in some years the number of reversals exceeded 20. Similarly, the number of reversals at the outer shelf locations were also clustered within 0 and 20 reversals. However, there was more spread in the number of reversals observed at buoy K. The number of reversals increased in the winter and spring seasons.
Using one-way ANOVA, seasonal differences in the number of reversal and persistence were estimated at each buoy station. At both buoys J and K, the number of reversals in the summer season was low (mean reversal ~6) and significantly different when compared with the number of reversals in the other seasons (mean reversal >14). However, at the other buoy locations there was no significant seasonal differences in the number of reversals. Downcoast persistence was also significantly different in the summer season with respect to the other seasons at most of the buoy locations. The duration of the downcoast flow was shorter in the summer season at all other buoy locations excluding buoys at J, N, and V. The mean downcoast durations at B, D, F, R, and W were consistently ≤1,000 h in summer season as against mean duration >1,500 h in the other seasons. Mean durations were generally lower at buoy K ranging from 700 h to 900 h in other seasons, but the summer season was lowest <300 h. No significant seasonal difference was observed in the downcoast flow durations at stations J and V. A distinct pattern was observed at buoy N as the downcoast flow durations in the spring and summer seasons (mean duration <600 h) were significantly different with shorter durations than in the fall and winter seasons (mean duration >800 h). Upcoast flow durations were significantly different only in the summer seasons given the longer flow durations. This was prominent at all the buoy locations excluding J, N, and V. No significant seasonal difference was estimated at buoy V. At buoys J and N, upcoast flow durations in the spring and summer seasons were significantly different with longer durations than in the fall and winter seasons.
Spatial variability in along-shore climatology and anomalies
Annual climatology (filtered and unfiltered) at daily intervals of the along-shore current velocity component is shown in (Figure 4). The unfiltered climatology was lowpass filtered using a window of 16 days to remove the signals within the weather band. At buoys located inshore of the 50-m isobath, the flow was upcoast in the summer but downcoast in the non-summer. However, there were spatial variabilities as to when the currents switched sign at these various locations. The transition first occurred at buoy J in early spring then gradually extended to the other buoy locations based on their proximities to buoy J. Hence, the late transition at the northmost buoy location R. When compared with the inner shelf buoys, a different pattern was observed at the outer shelf buoy locations. Current flow at these locations was mostly upcoast with intermittent downcoast flow. Magnitude of the upcoast flow in the summer was largest at buoy K. A pronounced peak was observed in July at buoy K, and all the coastal buoys excluding F and J. Despite buoy K being closer to J, the peak observed at buoy J in May was also present at buoy D but not at buoy K.
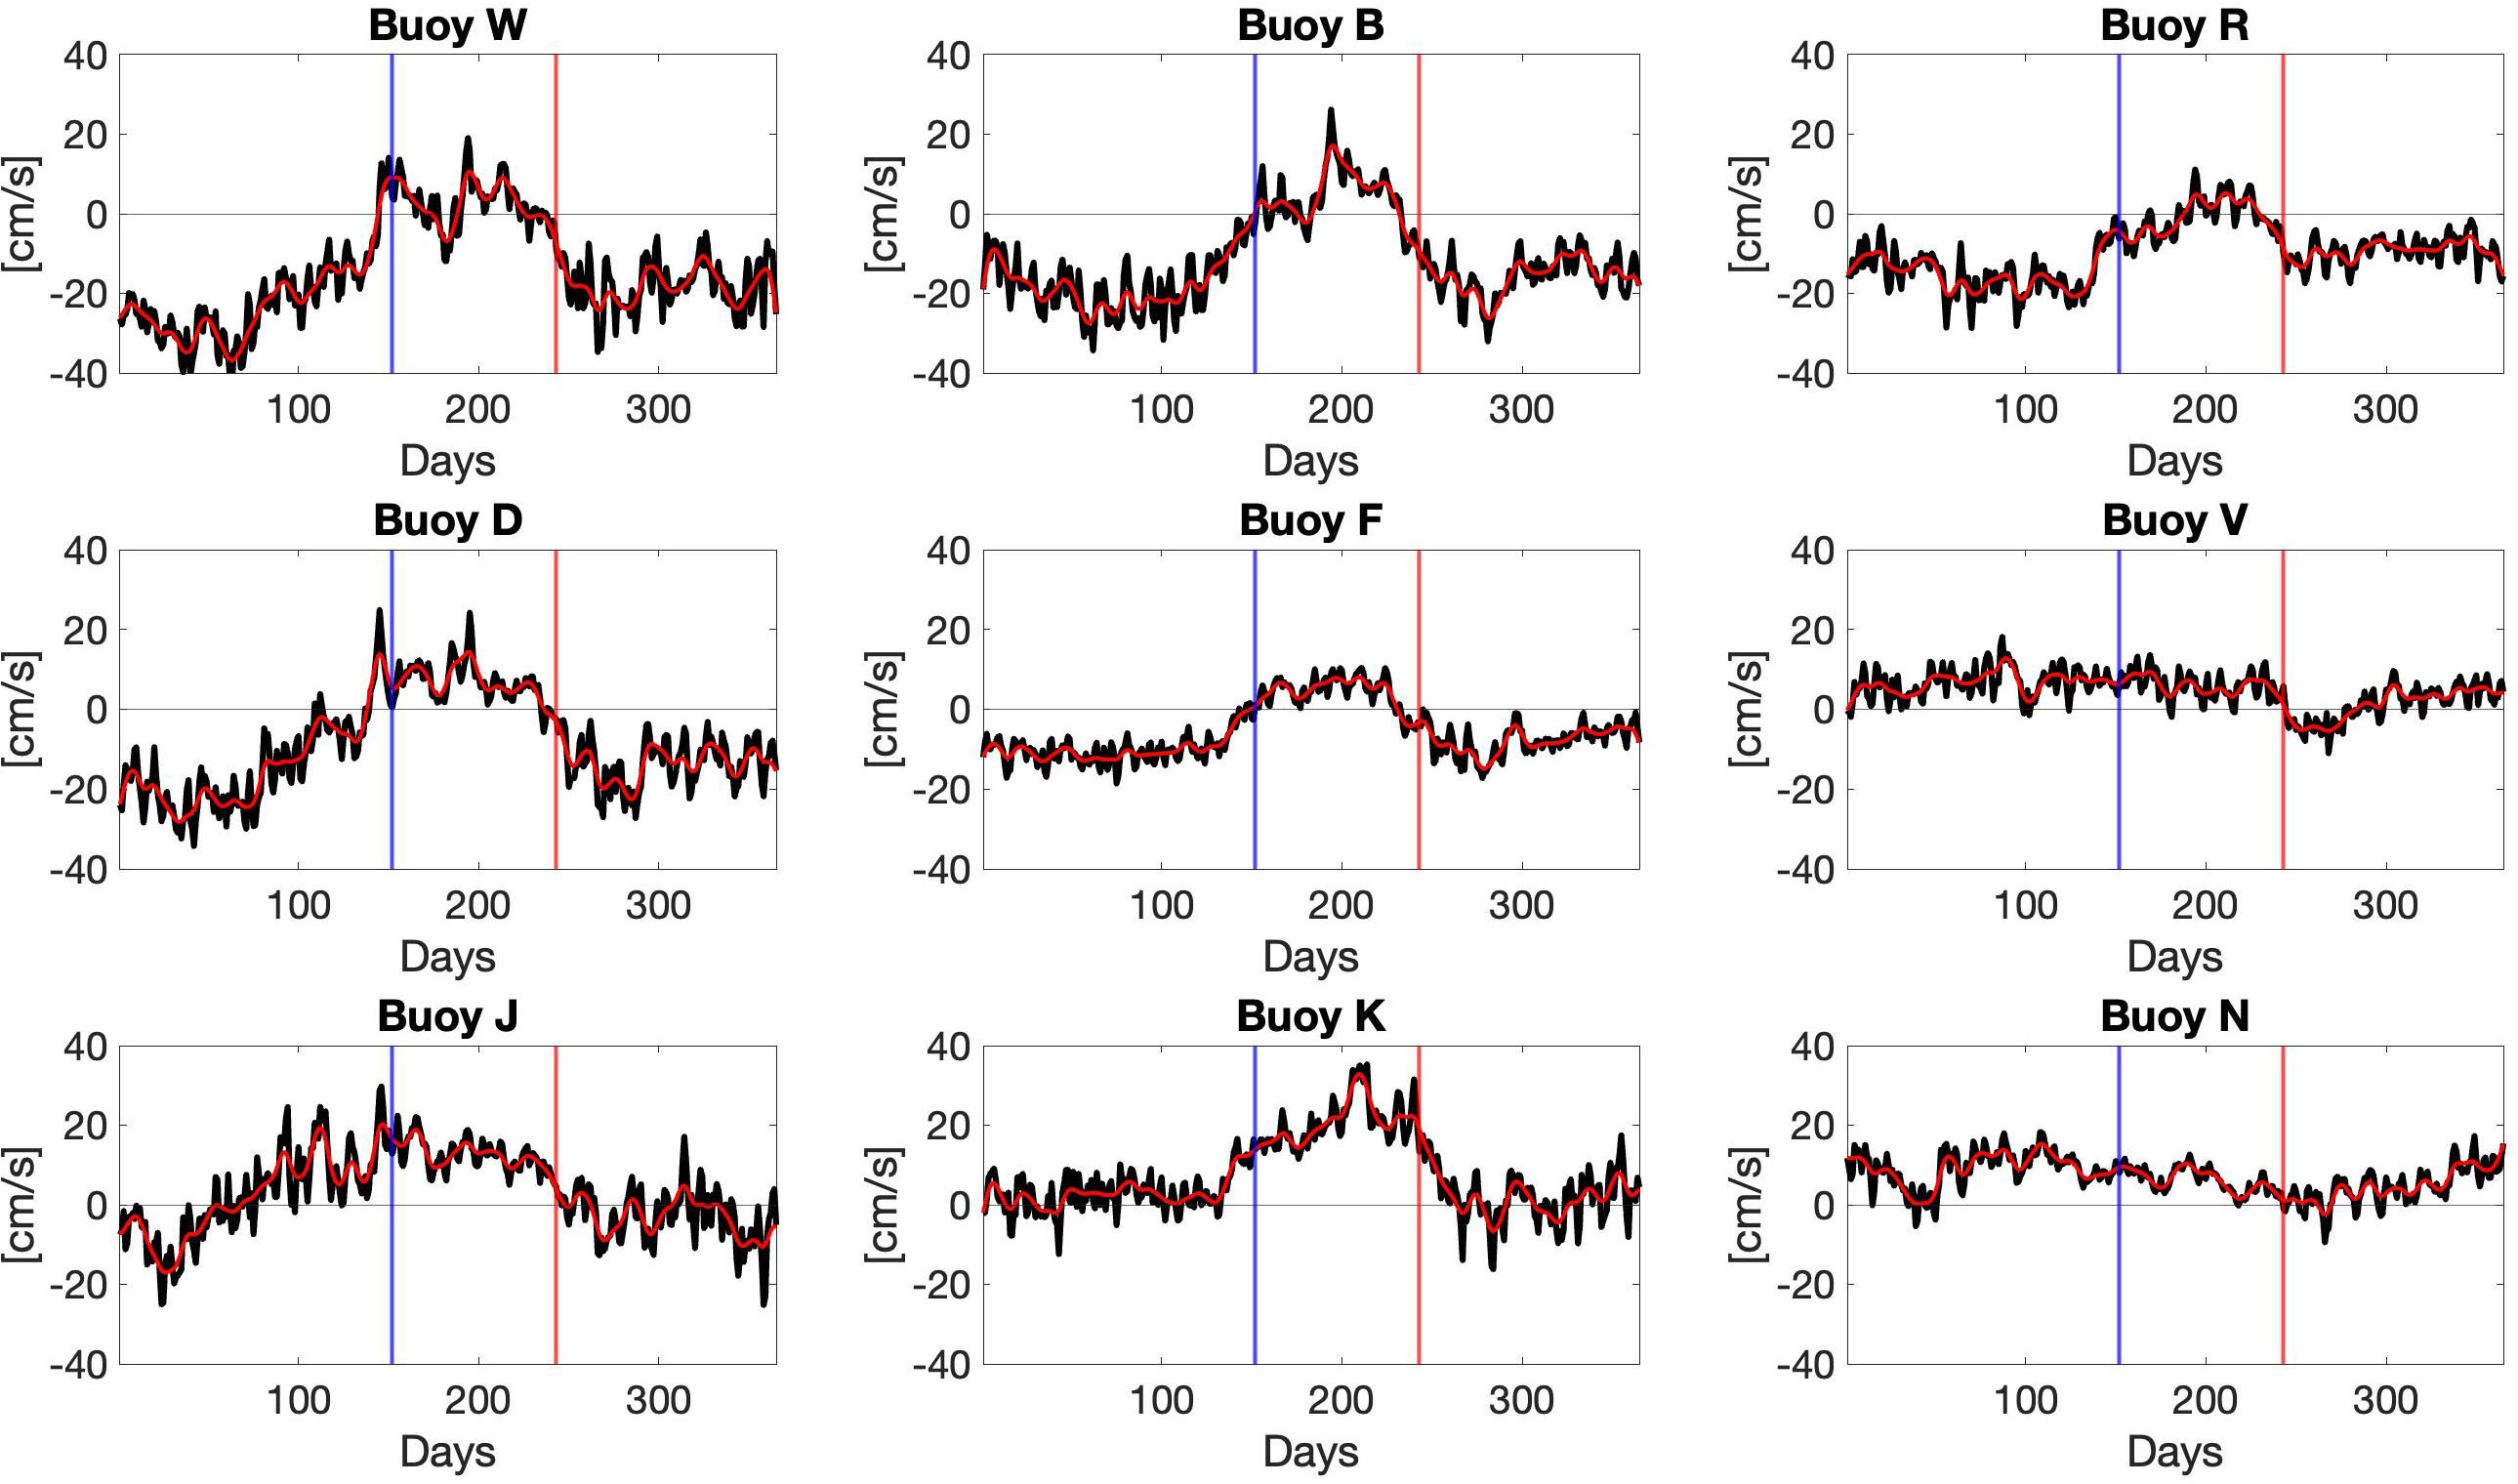
Figure 4 Annual climatology of the along-shore currents components at the nine TABS locations; unfiltered and filtered climatology in black and red, respectively. The beginning and end of the summer season is indicated by the respective vertical blue and red lines.
Further spatial variabilities in the annual climatology at the buoy locations were deduced from the correlation coefficients at zero lag between the stations at the 95% confidence level. Inner shelf correlation coefficients between buoys B, R, and W were >70%. If D was included, the correlation coefficient with respect to other inner buoys was also >70% but reduced to 68% for the correlation between D and R. By further incorporating buoy J, which is the final inner shelf buoy, the correlation coefficient was >70% between J, D, and W. The correlation involving J and the two farther inner shelf buoys B and R reduced to 58% and 32%, respectively. Despite being considered an outer shelf buoy, statistically significant correlations were estimated between buoy K and the inner shelf buoys but not with buoys N and V. In contrast, climatology of buoys N and V were statistically correlated but not with the inner shelf stations.
Relationship between the along-shore components of current and wind
Along-shore current anomalies with respect to the filtered climatology of each station are shown in Figure 2 Appendix. The timeseries were intended for estimating the interannual variability within the weather band through wavelet analysis. Due to the constraint in extracting continuous dataset of corresponding timestamps between the along-shore components of the current and wind climatology anomalies, only stations D, K, and R were used in the analysis. The resulting current timeseries length were ~13 months for station R and ~33 months for stations K and R.
Results of the wavelet analysis for the along-shore current data for stations D, K, and R (Figure 5) were rectified following Liu et al. (2007). Based on the time-averaged wavelet spectrum (right panels), the dominant periods range from 3 days to 12. The spectrum from D was rarely significant with periods 5 and 8 days as the only significant periods. At K and R, the statistically significant period bands were 3–8 and 4–12 days, respectively. However, the time-averaged wavelet spectrum does not provide a temporal evolution of the spectrum.
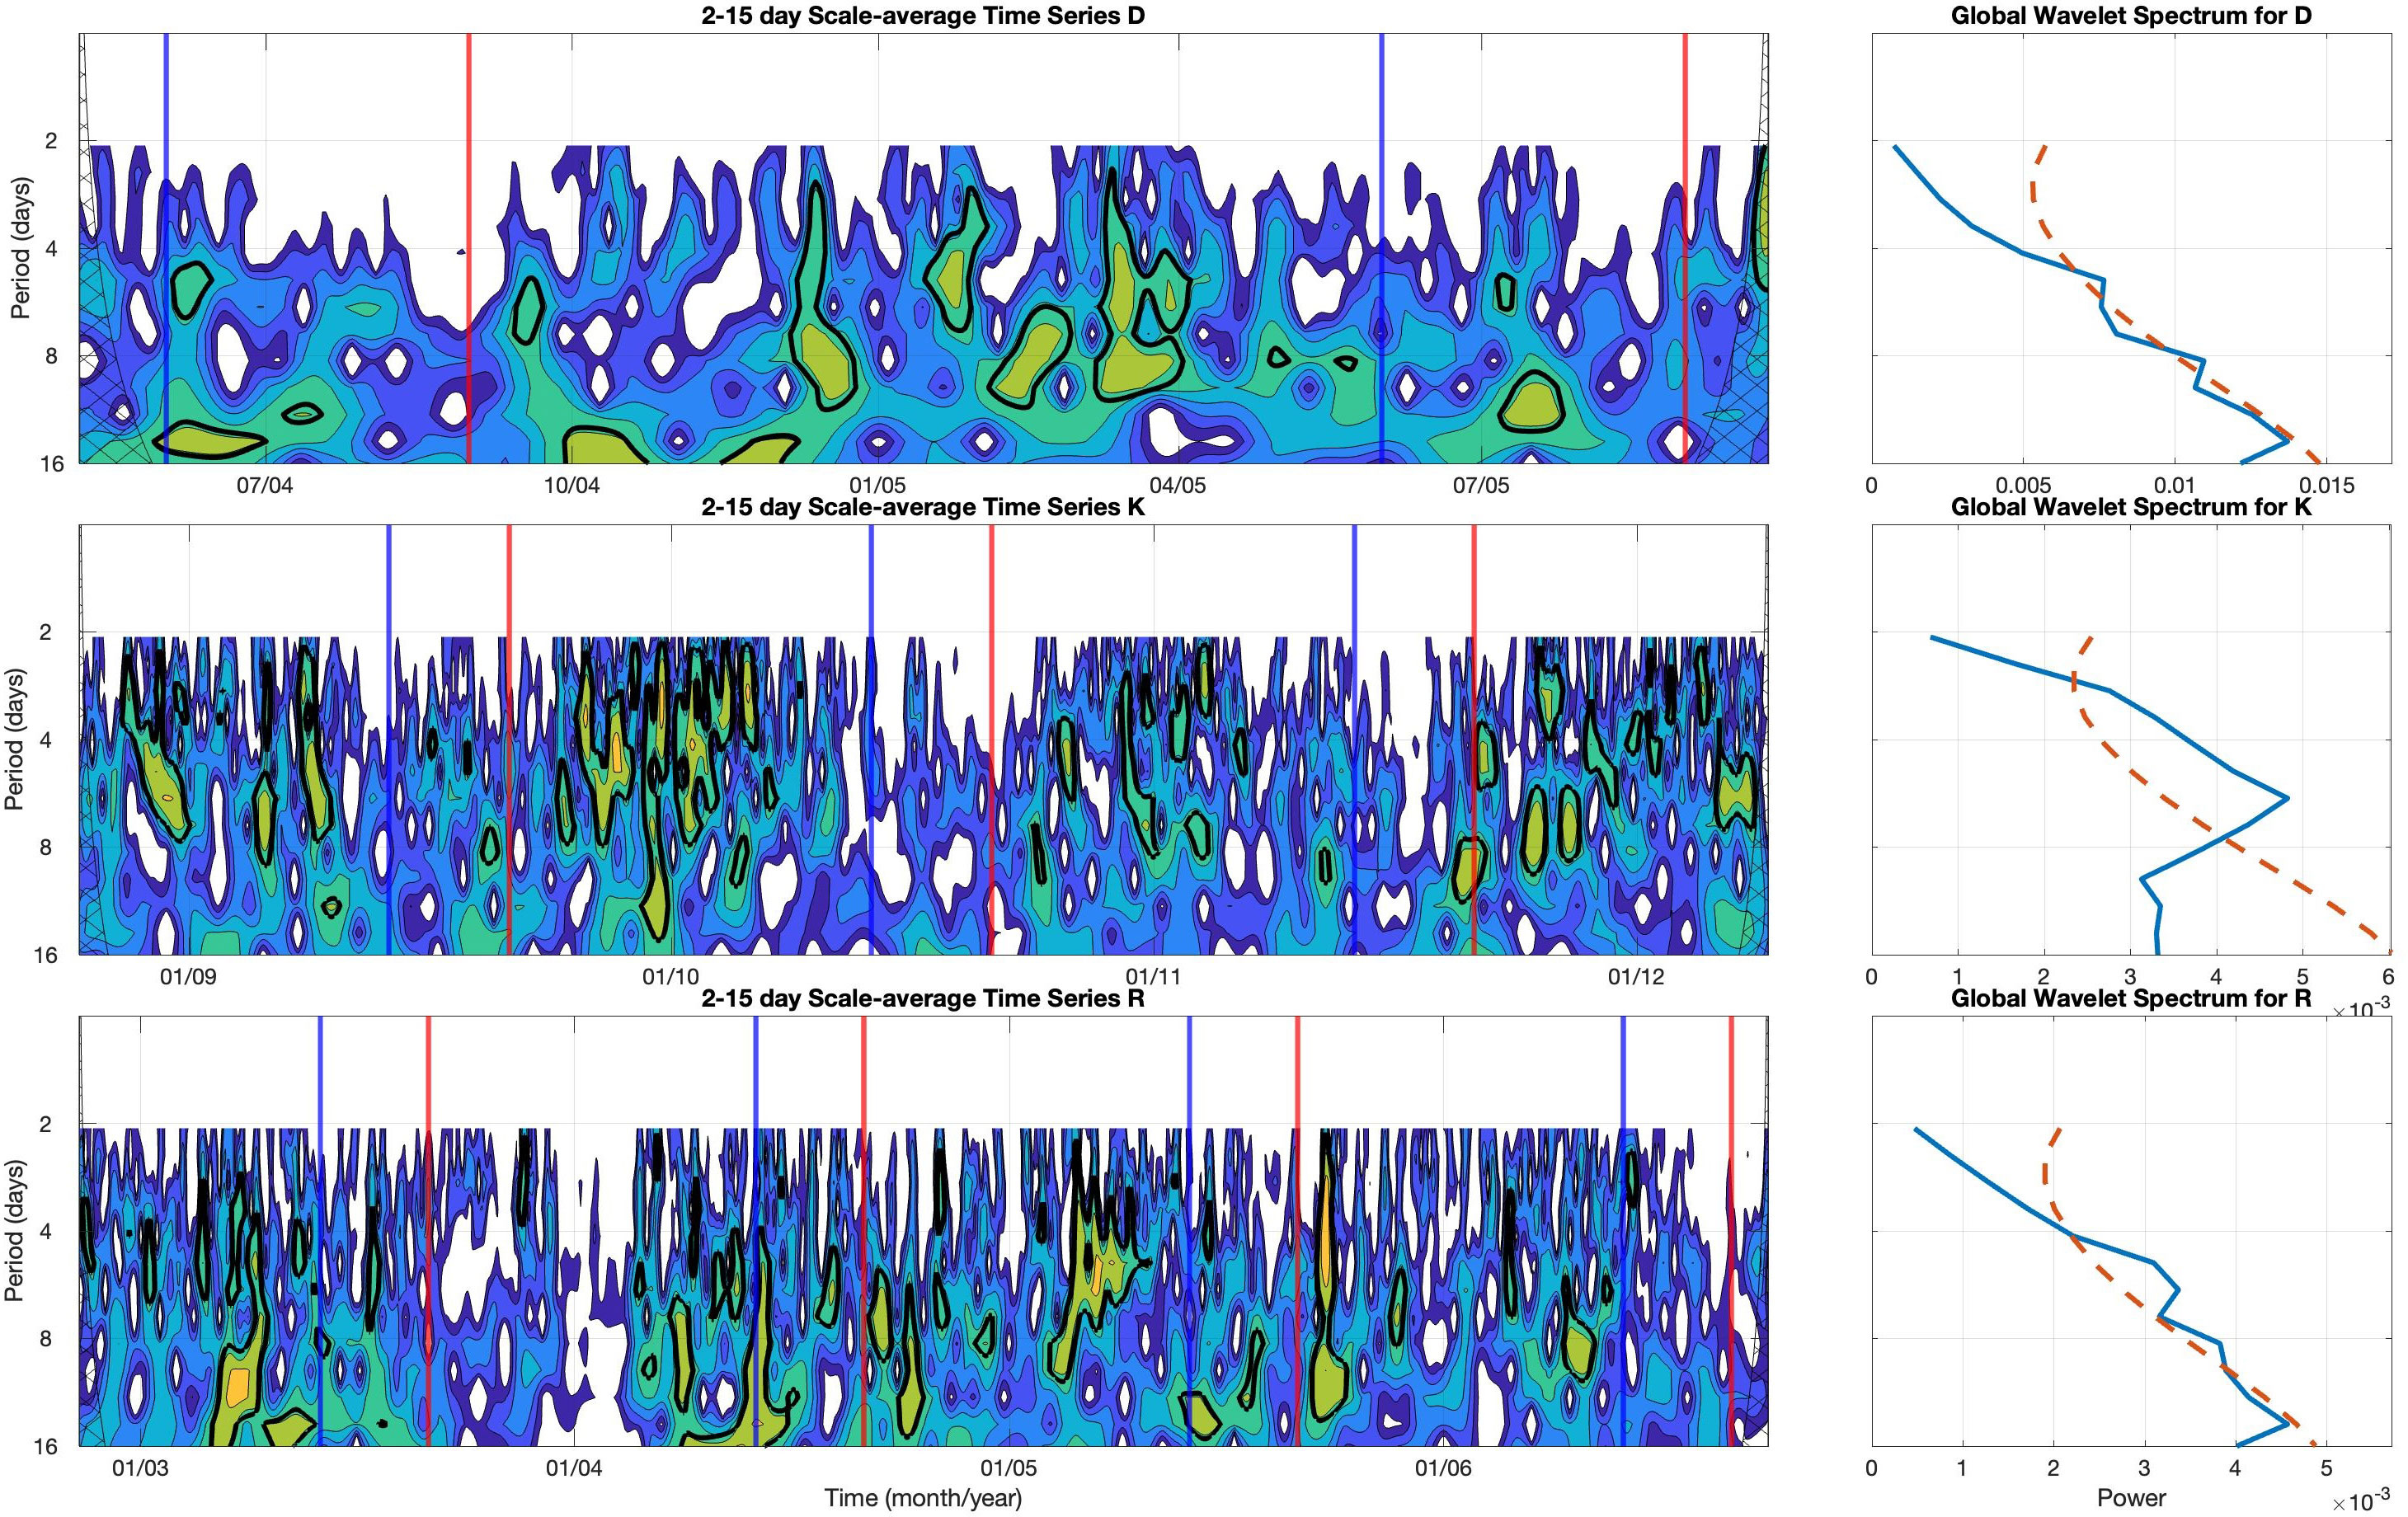
Figure 5 Wavelet analysis of the along-shore currents at D, K, and R. [left panel] Wavelets power spectra (filled contour), 95% confidence level (solid black line), and summer season (vertical blue and red lines), [right panel] variance preserved time-averaged wavelet power spectra and 95% confidence level (cyan dash).
The wavelet power spectra (left panel) revealed the seasonal (D only) and interannual (K and R) variability of the frequencies within the weather band. Statistically significant spectra were highlighted by the black contour. Based on all the spectra, the energies in the weather band were not significant throughout a given year and there were instances of low energies as depicted by the white patches within the weather band period. Despite the differences in the timeframe of the respective time series, some similarities were observed in the wavelet power spectra. Energies in the weather band were consistently low and mostly insignificant in the summer season when compared with the other seasons. Period bands greater than 8 days were not as significant as periods band 3–8 days. Some differences were also observed. At buoy K, energies within the weather band peak mostly in the winter season. However, at R the weather band energies were also low and mostly insignificant in the winter season.
Cross-spectral analysis (Figure 6) shows the relationship between the along-shore components of the current and wind velocities at stations D, K, and R. The coherences estimated at most of the frequencies are statistically significant. While no pattern was observed at D, two different patterns were present at K and R. The magnitude of the coherence squared magnitude increased toward low periods at K and an opposite trend was present at R. The least maximum coherence was at R.
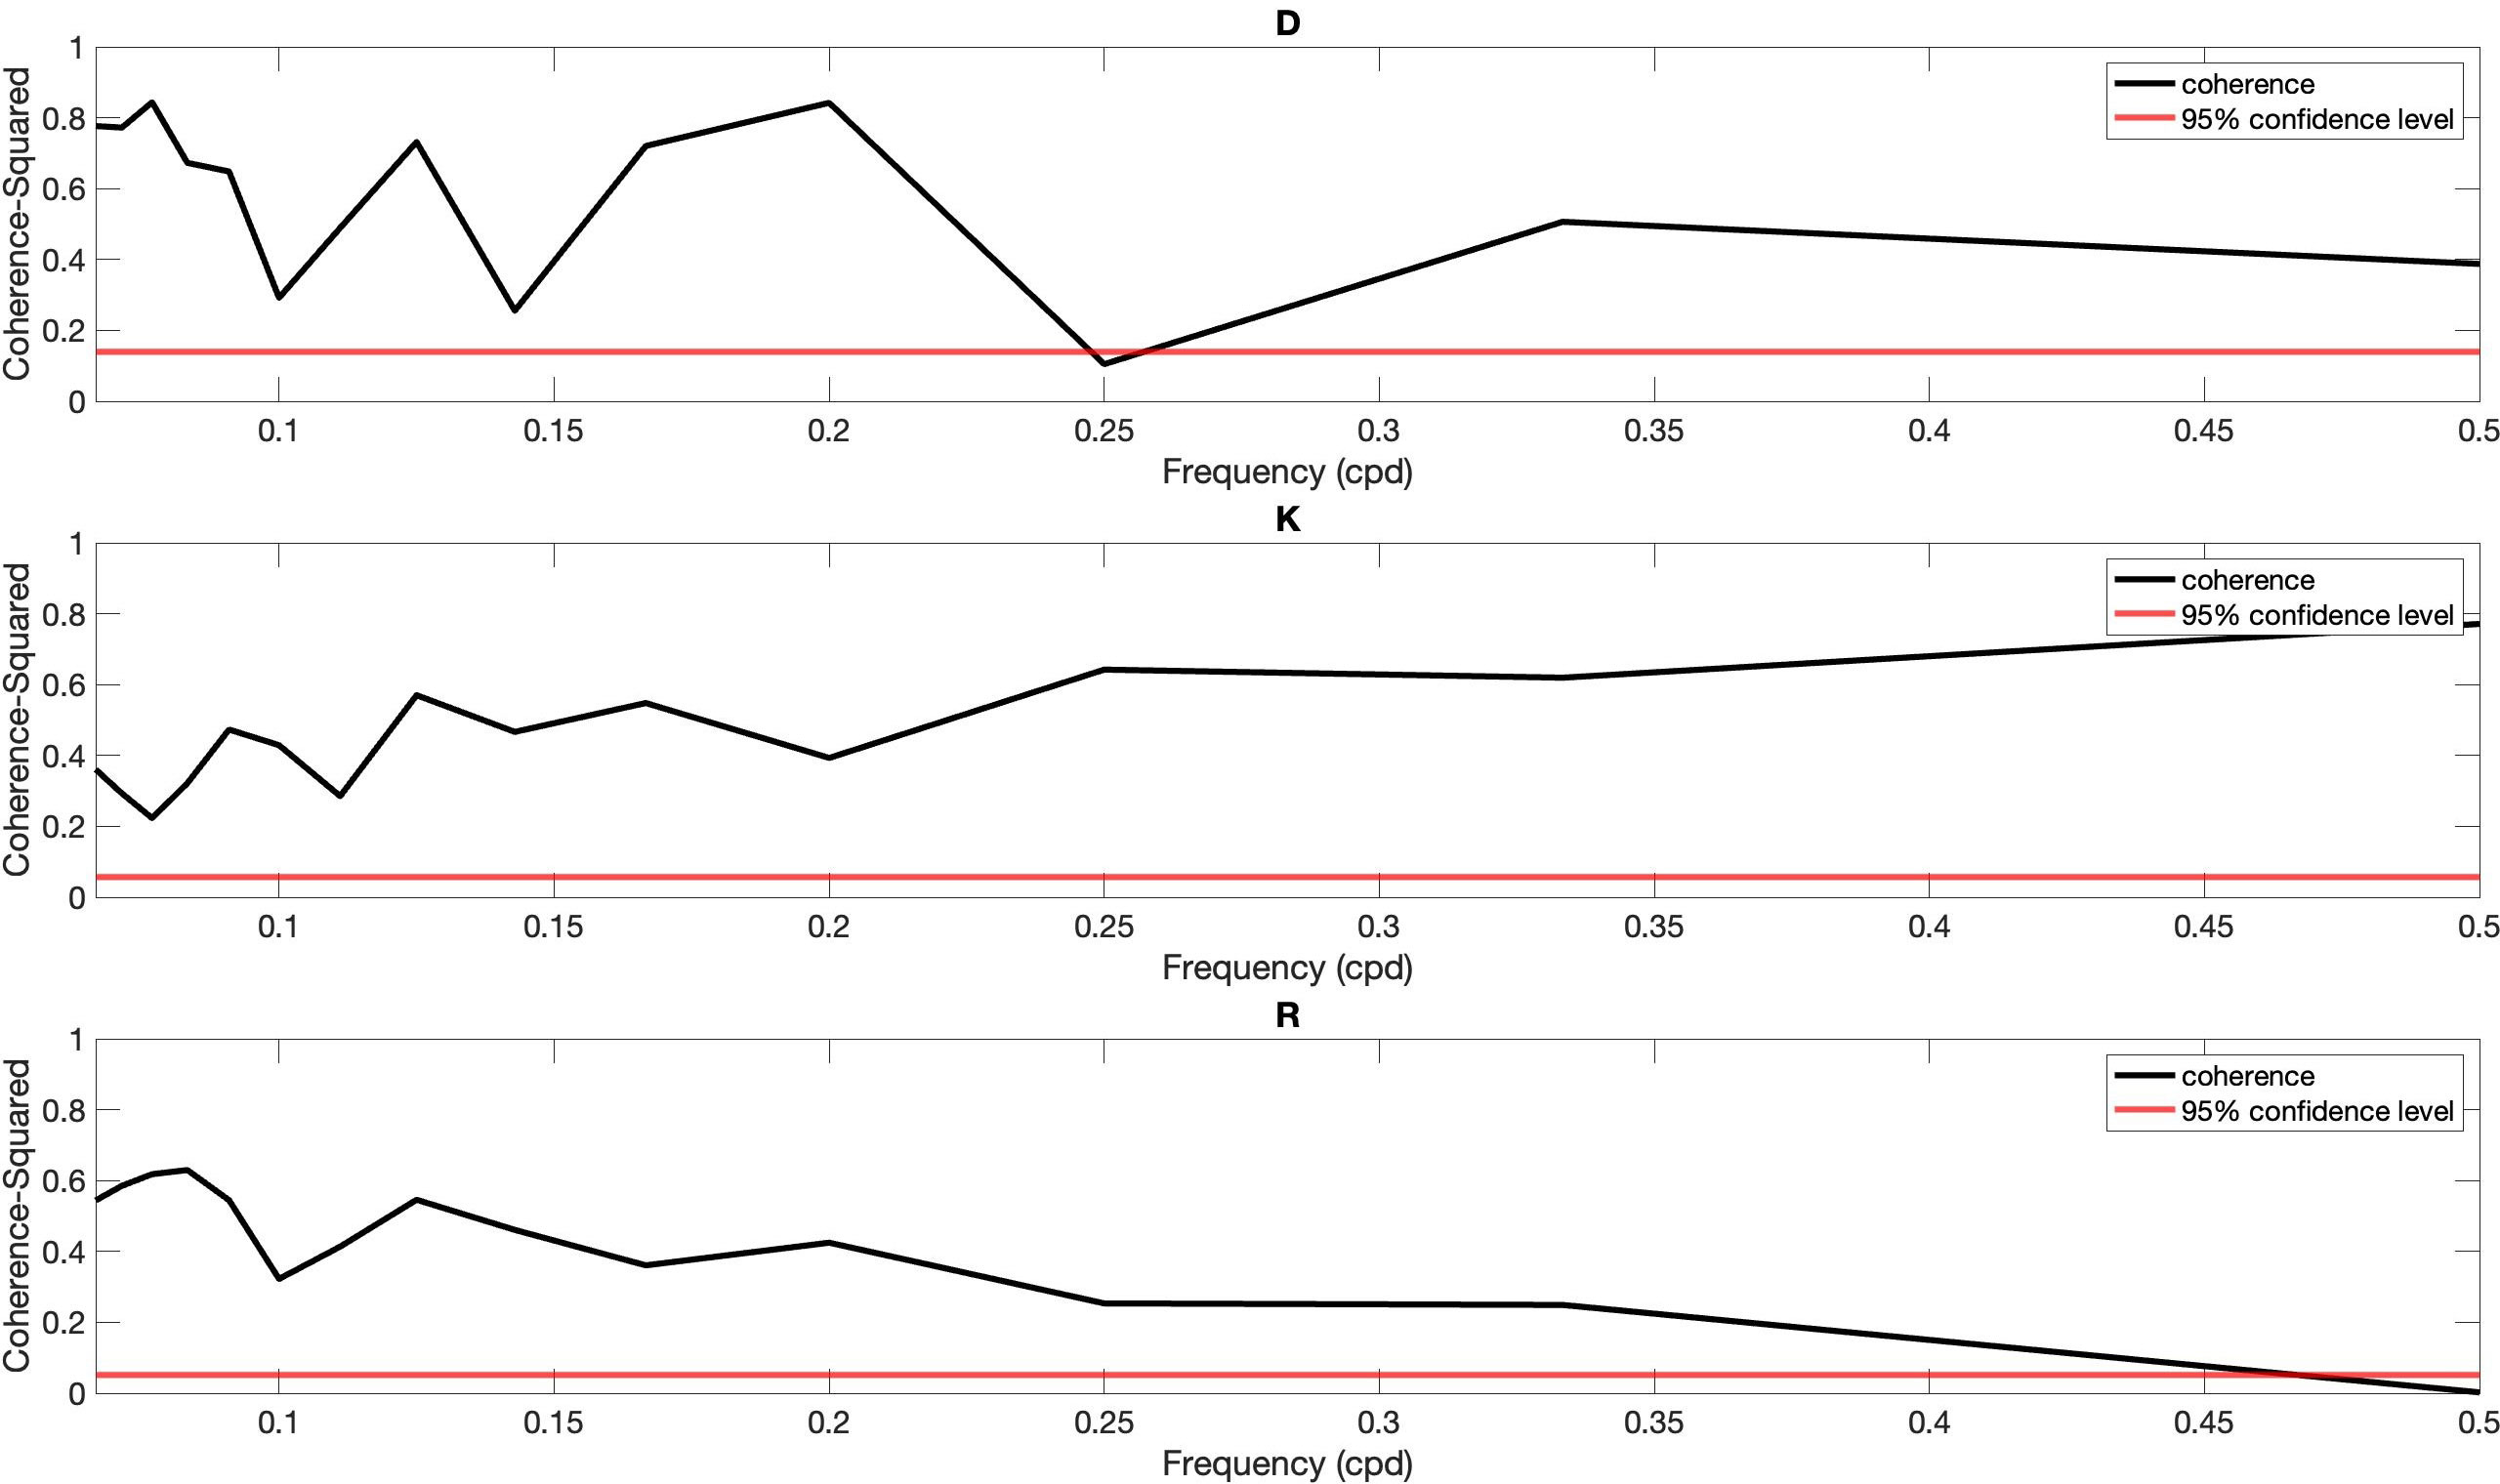
Figure 6 Coherence spectra for the along-shore wind and currents components at D, K, and R with a 95% confidence level in red.
Discussion and conclusion
Using the TABS current data from nine stations, we describe the near-surface circulation on the inner, mid, and outer regions of the Texas Shelf devoid of the contributions from processes with time scales on the order of 2 days. Near-surface currents on the Texas Shelf were mainly along the isobaths. Given the low mean and standard deviation in the across-shore velocity component with respect to the along-shore component, if the correlation of the variabilities of oceanographic variables such as temperature and velocity is similar in the along- and across-shore, there will be reduced horizontal mixing in the across-shore resulting in a pronounced temperature gradient in the across-shore direction. On the inner and mid shelves, the mean flow was downcoast except at buoy J. However, the mean flow was upcoast and consistent at all the buoy locations on the outer shelf. A similar circulation pattern was also noted in Nowlin et al. (2005). However, the circulation on the Texas Shelf based on the mean flow does not highlight the seasonal variabilities of the circulation on the Texas Shelf. Upcoast flow was consistent throughout the seasons of the year on the outer shelf. However, the flow on the inner and mid shelves fluctuates between upcoast in the summer and downcoast in the non-summer. This apparent spatial variability implies that there are two dominant regions on the Texas shelf which are separated by the 50-m isobath; one part is shoreward of the 50-m isobath comprising the inner and mid shelf regions, whereas the other part is offshore of the 50-m isobath comprising only the outer shelf region. This is consistent with the findings of Nowlin et al. (2005).
Annual climatology of the along-shore current components further reveals the spatial variabilities of the near surface current on the Texas Shelf. Upcoast flow observed in the summer over the entire Texas Shelf was consistent with the mode 1 of the empirical orthogonal functions reported in Cho et al. (1998). However, in the other seasons the spatial differences in the currents between the inner/mid shelves and the outer shelf was not captured in the mode. Considering that the stream function field in Cho et al. (1998) was estimated using current data mostly at depths lower than or equal to 10 m, it implies that baroclinic flow is prevalent on the outer shelf in the non-summer seasons whereas barotropic flow prevails in the summer within 10 m of the surface layer. Meanwhile, the inner/mid shelf is more barotropic favorable. Furthermore, the spatial variabilities observed from March to May between J and the rest of the inner shelf buoys was not present in the mode. However, the spatial variabilities were consistent with CK86 and Nowlin et al. (2005), as both alluded to the early transition from downcoast to upcoast in the region of the inner shelf bounding Mexico. In summary, the climatology not only shows the low-frequency current reversal on the shelf, which was the focus of previous studies, but also the high-frequency oscillations within the weather band.
Based on the analysis of the number of reversals and persistence in this study, there was more than one reversal of the along-shore current each year contrary to CK86. Figure 2 shows that the along-shore currents reversed between upcoast and downcoast numerous times in a season. No statistical differences were observed in the number of reversals among the four seasons at all the stations except the two southmost stations (J and K) where the number of reversals was smaller in the summer compared with the other seasons.
Variabilities in the persistence and magnitude of the along-shore currents over the reversals provided some information about the potential stresses from the near-surface current. Upcoast flow and downcoast flow were not equally persistent in each season. Non-summer seasons were more downcoast leaning, whereas the summer seasons were more upcoast leaning on the inner/mid shelf except at J where upcoast flow was also dominant in the spring season. On the inner/mid shelf, the most persistent velocity magnitudes were within 0–30 cm s–1 and they could persist for as long as 5 days. Higher velocity magnitudes were mostly within the 2-day persistence period. As such, engineering structures erected on the inner and mid shelves will experience more stress from the downcoast flow in the surface layer, whereas offshore structures will experience more stress from the upcoast flow in the surface layer considering the prevalence of the upcoast flow over the entire the seasons. Despite having low data availability and shorter records, velocity magnitudes on the order of 50 cm s–1 were observed to persist for as long as 5 days at the offshore locations. This implies that the magnitude of the stress to the offshore structures supersedes the stress to the inner/mid shelf structures.
Previous studies showed that at seasonal scales, wind is the primary mechanism responsible for the inner/mid shelf flow whereas mesoscale features are responsible for the outer shelf flow. This study further determines that within the weather band, the influence of the wind prevails at certain bands on the Texas shelf. Based on the magnitude squared coherency at D and R, the contribution of the wind on the inner/mid shelf prevails over the 8–15-day weather band and the wavelet results also show that the dominant spectral power was within this window. Nowlin et al. (1998) acknowledged that the region experiences frequent frontal passages; as such, the variability in the inner/mid shelf along-shore current within the 8–15-day weather band is attributed to the sub-inertial component of the currents response due to the passage of cold fronts. In addition to the passage of fronts, hurricanes also contribute to the energies in the weather band on the inner/mid shelf as Hurricane Rita did in 2005 (see Figure 5 for buoys D and R). This resulted from the sub-inertial response of the Texas Shelf to the passage of the hurricane as shown in the first and third wavelet spectra. Wavelet power spectra for R show that the entire weather band was almost significant during this period. A similar signal was observed in the cone of influence of the wavelet power spectra for D. However, it cannot be neglected considering that the period of the signal overlaps with a corresponding signal in R.
From the magnitude squared coherency at K, wind influenced the circulation on the outer shelf within the weather band. Unlike the inner/mid shelf, the contribution of frontal passages was reduced on the outer shelf and the prevalent magnitude squared coherency was at the high-frequency band (2–4 days) of the weather band. This was consistent with the conclusions of Nowlin et al. (2005), who using data at comparative timescales reported on the influence of the wind to outer shelf circulation but at a lesser magnitude compared with the contributions of mesoscale features. Consequently, other processes such as cyclonic and anticyclonic anomalies dominate the contributions of the wind. CK86 reported on the varied upcoast and downcoast flows on the outer shelf due to the alternation of cyclonic and anticyclonic formations in the vicinity of the outer shelf. The results of this study support the finding based on the varied dominance of upcoast and downcoast flow observed on the outer shelf in the fall and winter.
Data availability statement
The datasets presented in this study can be found in online repositories. The names of the repository/repositories and accession number(s) can be found below: TABS webpage (http://tabs.gerg.tamu.edu/tglo), GCOOS website (https://data.gcoos.org) and on National Data Buoy Center’s (NDBC) website (http://ndbc.noaa.gov).
Author contributions
Everyone participated in the writing of the manuscript. JW designed the system used in the measurement of the data. All authors contributed to the article and approved the submitted version.
Funding
The author(s) declare financial support was received for the research, authorship, and/or publication of this article. This study was funded by contracts from the Texas General Land Office to the Geochemical Environmental Research Group (GERG) of Texas A&M University.
Acknowledgments
We thank the many staff members of GERG to the continual dedication to the Texas Automated Buoy System: FJ Kelly, W. Flemings, M. Bohn, A. Dancer, S Jarnigan, E. Webb, J. Pocock, R Albers, LL Lee, A Malakhovsky, A Lueke. Additional thanks go to R Martin, S Buschang, and B Koza (TGLO). We also appreciate the contributions of Dr. Dmitri Netcheav.
Conflict of interest
The authors declare that the research was conducted in the absence of any commercial or financial relationships that could be construed as a potential conflict of interest.
Publisher’s note
All claims expressed in this article are solely those of the authors and do not necessarily represent those of their affiliated organizations, or those of the publisher, the editors and the reviewers. Any product that may be evaluated in this article, or claim that may be made by its manufacturer, is not guaranteed or endorsed by the publisher.
References
Bianchi T. S., DiMarco S. F., Cowan J. H. Jr., Hetland R. D., Chapman P., Day J. W., et al. (2010). The science of hypoxia in the Northern Gulf of Mexico: a review. Sci. Total Environ. 408 (7), 1471–1484. doi: 10.1016/j.scitotenv.2009.11.047
Chen C., Reid R. O., Nowlin W. D. Jr. (1996). Near‐inertial oscillations over the Texas‐Louisiana shelf. J. Geophys. Res.: Oceans 101 (C2), 3509–3524. doi: 10.1016/j.scitotenv.2009.11.047
Cho K., Reid R. O., Nowlin W. D. Jr. (1998). Objectively mapped stream function fields on the Texas-Louisiana shelf based on 32 months of moored current meter data. J. Geophys. Res. 103, 10,377–10,390. doi: 10.1029/98JC00099
Cochrane J. D., Kelly F. J. (1986). Low-frequency circulation on the Texas- Louisiana continental shelf. J. Geophys. Res. 91 (C2), 10,645–10,659. doi: 10.1029/JC091iC09p10645
Daddio E. D., Wiseman W. J. Jr., Murray S. P. (1978). Inertial currents over the inner shelf near 30 N. J. Physical Oceanography 8 (4), 728–733.
DiMarco S. F., Reid R. O. (1998). Characterization of the principal tidal current constituents on the Texas-Louisiana shelf. J. Geophys. Res.: Oceans 103 (C2), 3093–3109.
DiMarco S. F., Howard M. K., Reid R. O. (2000). Seasonal variation of wind-driven diurnal current cycling on the Texas-Louisiana Continental Shelf. Geophys. Res. Letters 27 (7), 1017–1020.
Dzwonkowski B., Park K., Collini R. (2015). The coupled estuarine-shelf response of a river-dominated system during the transition from low to high discharge. J. Geophysical Research: Oceans 120 (9), 6145–6163. doi: 10.1002/2015JC010714
Etter P. C., Howard M. K., Cochrane J. D. (2004). Heat and freshwater budgets of the Texas-Louisiana shelf. J. Geophysical Research: Oceans 109 (C2). doi: 10.1029/2003JC001820
Hamilton P. (1992). Lower continental slope cyclonic eddies in the central Gulf of Mexico. J. Geophysical Research: Oceans 97 (C2), 2185–2200. doi: 10.1029/91JC01496
Kelly F. J., Guinasso N. L., Lee L. L. III, Chaplin G. F., Magnell B. A., Martin Jr R. D., et al. (1998). Texas Automated Buoy System (TABS): A public resource: A public resource. Proc. Oceanol. Internation. 98 Exhibition and Conference. 1, 103–112
Li Y., Nowlin W. D. Jr., Reid R. O. (1996). Spatial-scale analysis of hydrographic data over the Texas-Louisiana continental shelf. J. Geophys. Res. 101 (C9), 20,595–20,605. doi: 10.1029/96JC02163
Liu Y., Liang X. S., Weisberg R. H. (2007). Rectification of the bias in the wavelet power spectrum. J. Atmospheric Oceanic Technol. 24 (12), 2093–2102. doi: 10.1175/2007JTECHO511.1
Nowlin W. D. Jr., Jochens A. E., DiMarco S. F., Reid R. O., Howard M. K. (2005). “Low-frequency circulation over the Texas-Louisiana continental shelf,” in Circulation in the Gulf of Mexico: Observations and Models. Eds. Sturges W., Lugo-Fernandez A. (Washington, DC: American Geophysical Union), 219–240. doi: 10.1029/161GM17
Nowlin W. D. Jr., Jochens A. E., Reid R. O., DiMarco S. F. (1998). Texas-Louisiana Shelf Circulation and Transport Processes Study: Synthesis report, Volume 1: Technical report (New Orleans, LA: U.S. Dept. of the Interior, MMS 98-0035).
Nwankwo U., Howden S., Nechaev D., Dzwonkowski B. (2023). Subinertial sea surface heights anomalies estimated using high frequency radar surface current data in the Mississippi bight. J. Geophysical Research: Oceans 128 (3), e2022JC019055. doi: 10.1029/2022JC019055
Oey L. Y. (1995). Eddy-and wind-forced shelf circulation. J. Geophysical Research: Oceans 100 (C5), 8621–8637. doi: 10.1029/95JC00785
Schmitz W. J. Jr., Biggs D. C., Lugo-Fernandez A., Oey L. Y., Sturges W. (2005). A synopsis of the circulation in the Gulf of Mexico and on its continental margins. Washington DC Am. Geophysical Union Geophysical Monograph Ser. 161, 11–29. doi: 10.1029/161GM03
Smith N. P. (1978). Low-frequency reversals of nearshore currents in the northwestern Gulf of Mexico. Cont. Mar. Sci. 21, 103–115. doi: 10.1016/0278-4343(94)90109-0
Thomson R. E., Emery W. J. (2014). Data analysis methods in physical oceanography. 3rd edition (Amsterdam: Elsevier).
Walpert J., Guinasso N. L. Jr., Lee L. L., Martin R. D. (2011). Texas Automated Buoy System-sustainable ocean observations to help protect the environment. In OCEANS'11 MTS/IEEE KONA (pp. 1-7). IEEE.
Zhang X., DiMarco S. F., Smith D. C., Howard M. K., Jochens A. E., Hetland R. D. (2009). Near-resonant ocean response to sea breeze on a stratified continental shelf. J. Phys. Oceanography 39 (9), 2137–2155.
Zhang X., Smith D. C., Smith D. C., DiMarco S. F., Hetland R. D. (2010). A numerical study of sea-breeze-driven ocean Poincare wave propagation and mixing near the critical latitude. J. Phys. Oceanography 40 (1), 48–66.
Appendix
Figure 1: Length of time series and percentage of data availability at the nine TABS stations.
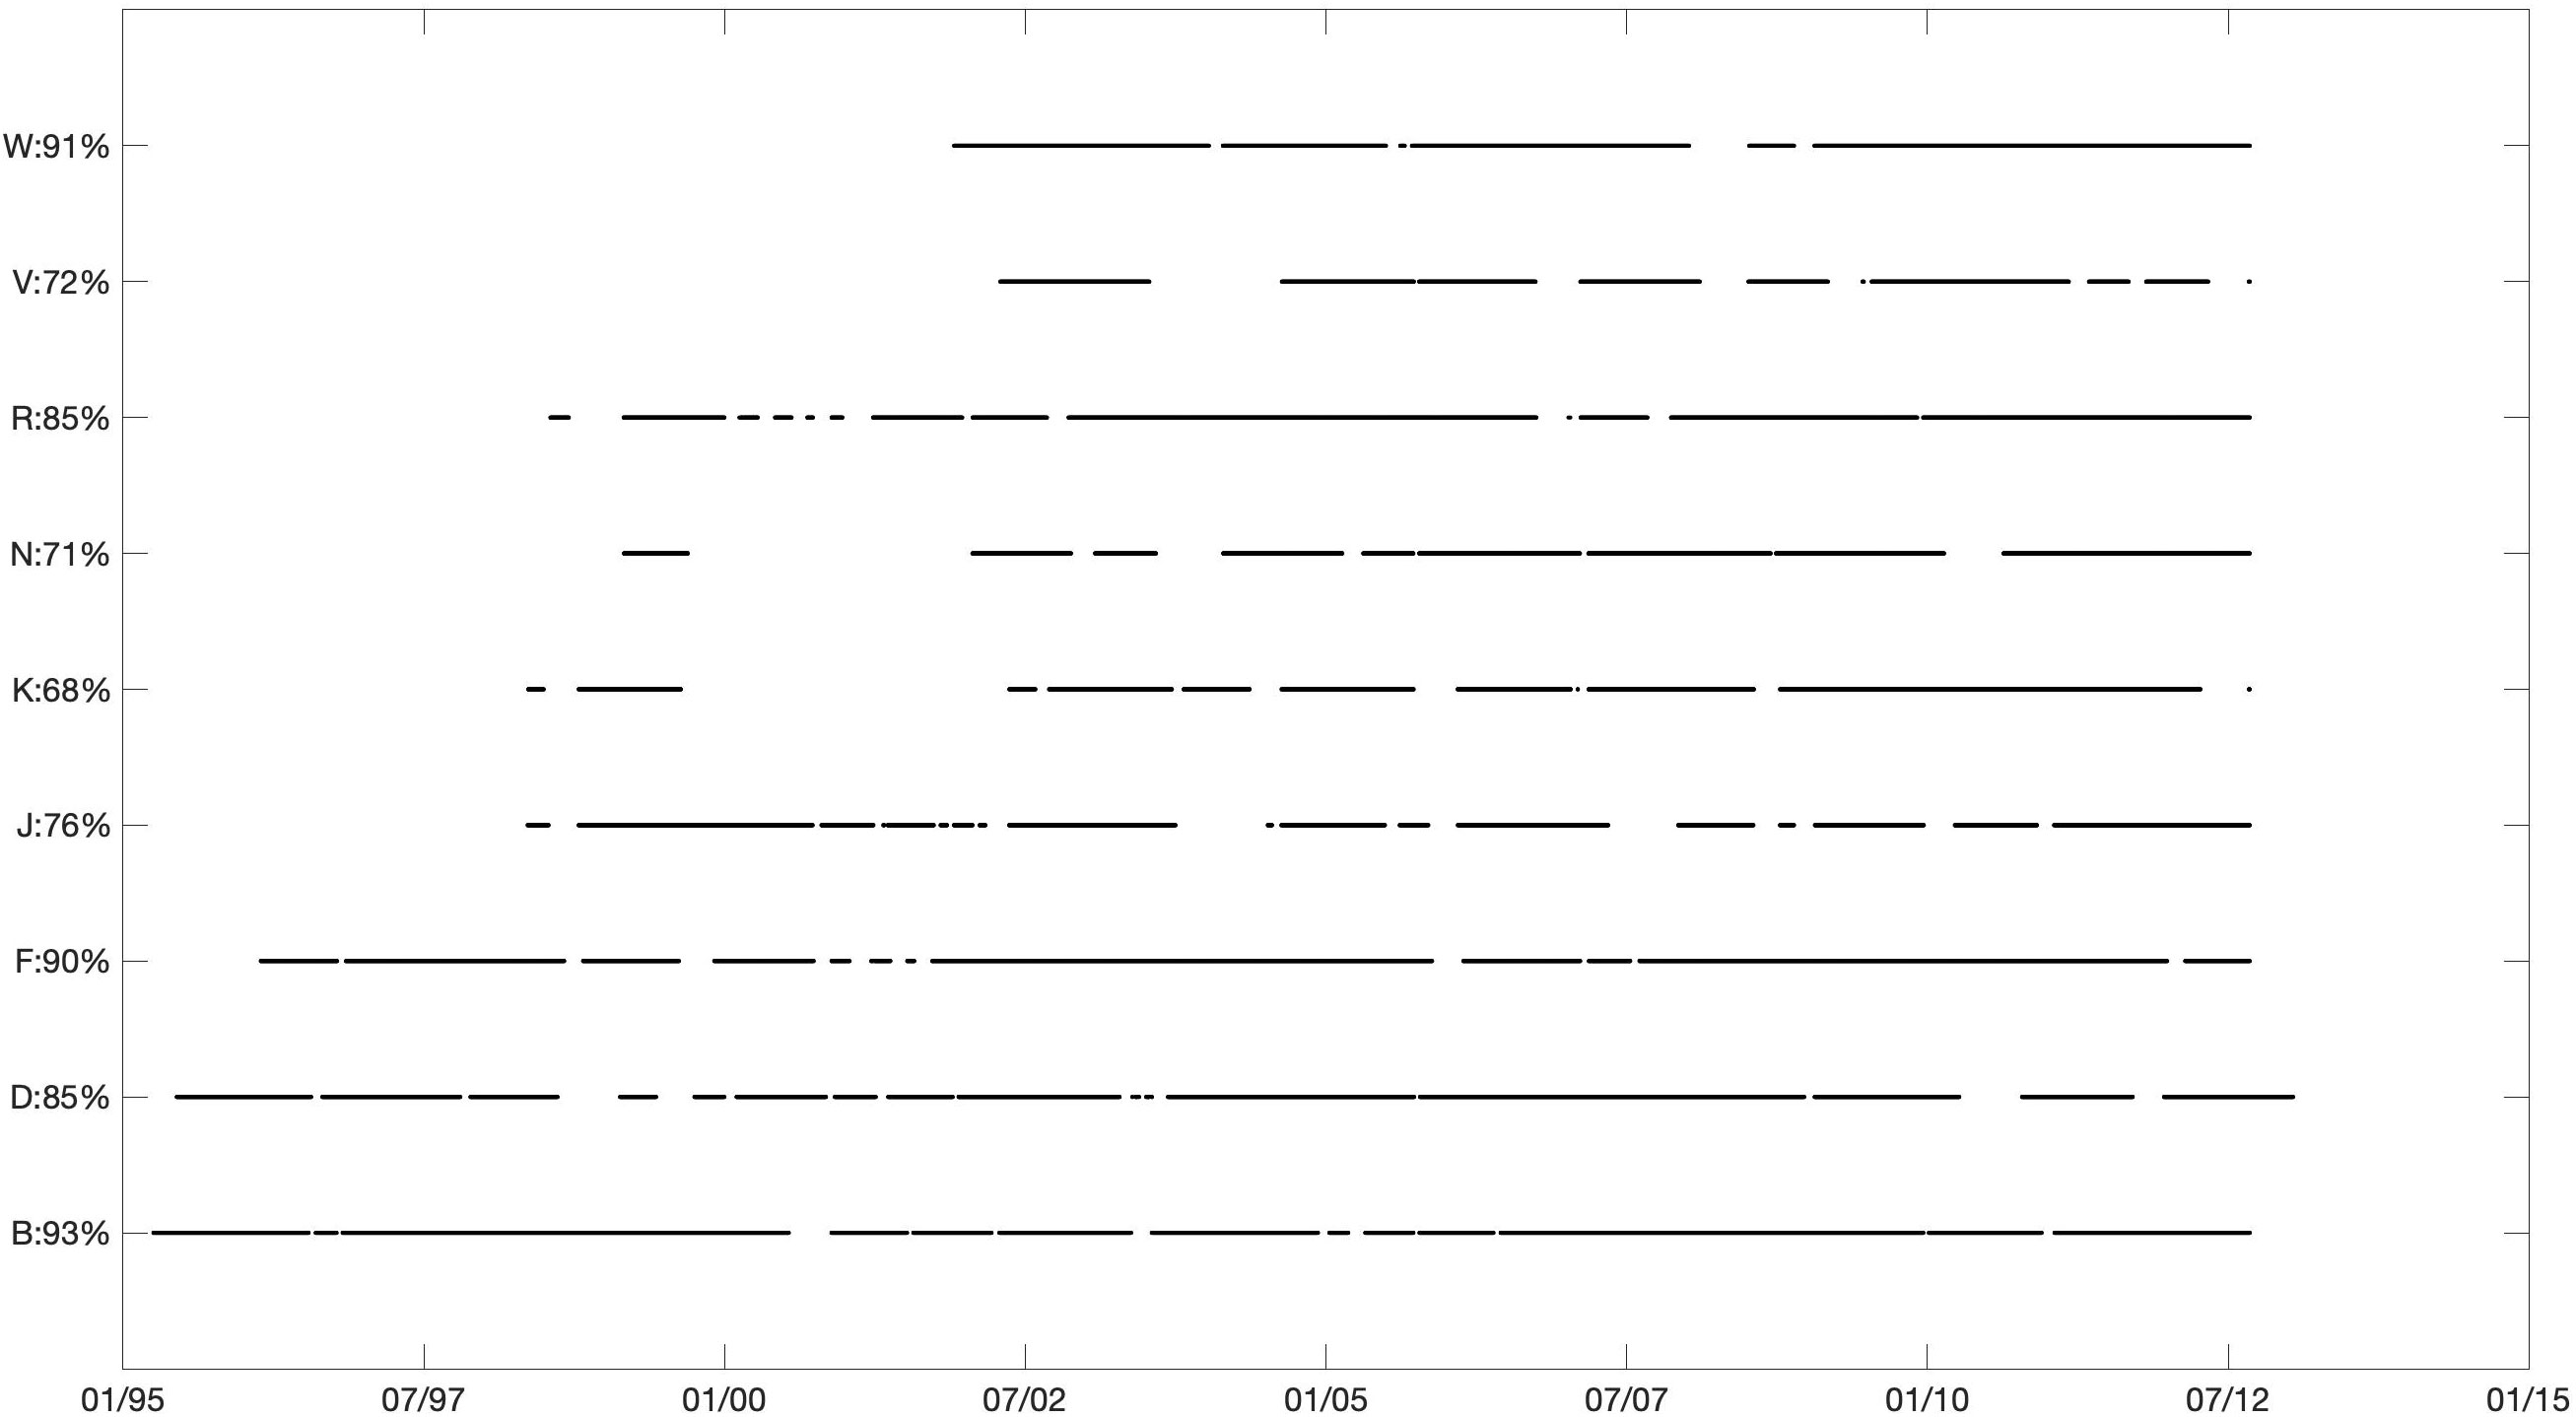
Figure 7
Figure 2: Climatology anomalies of the along-shore currents components at the nine TABS locations.
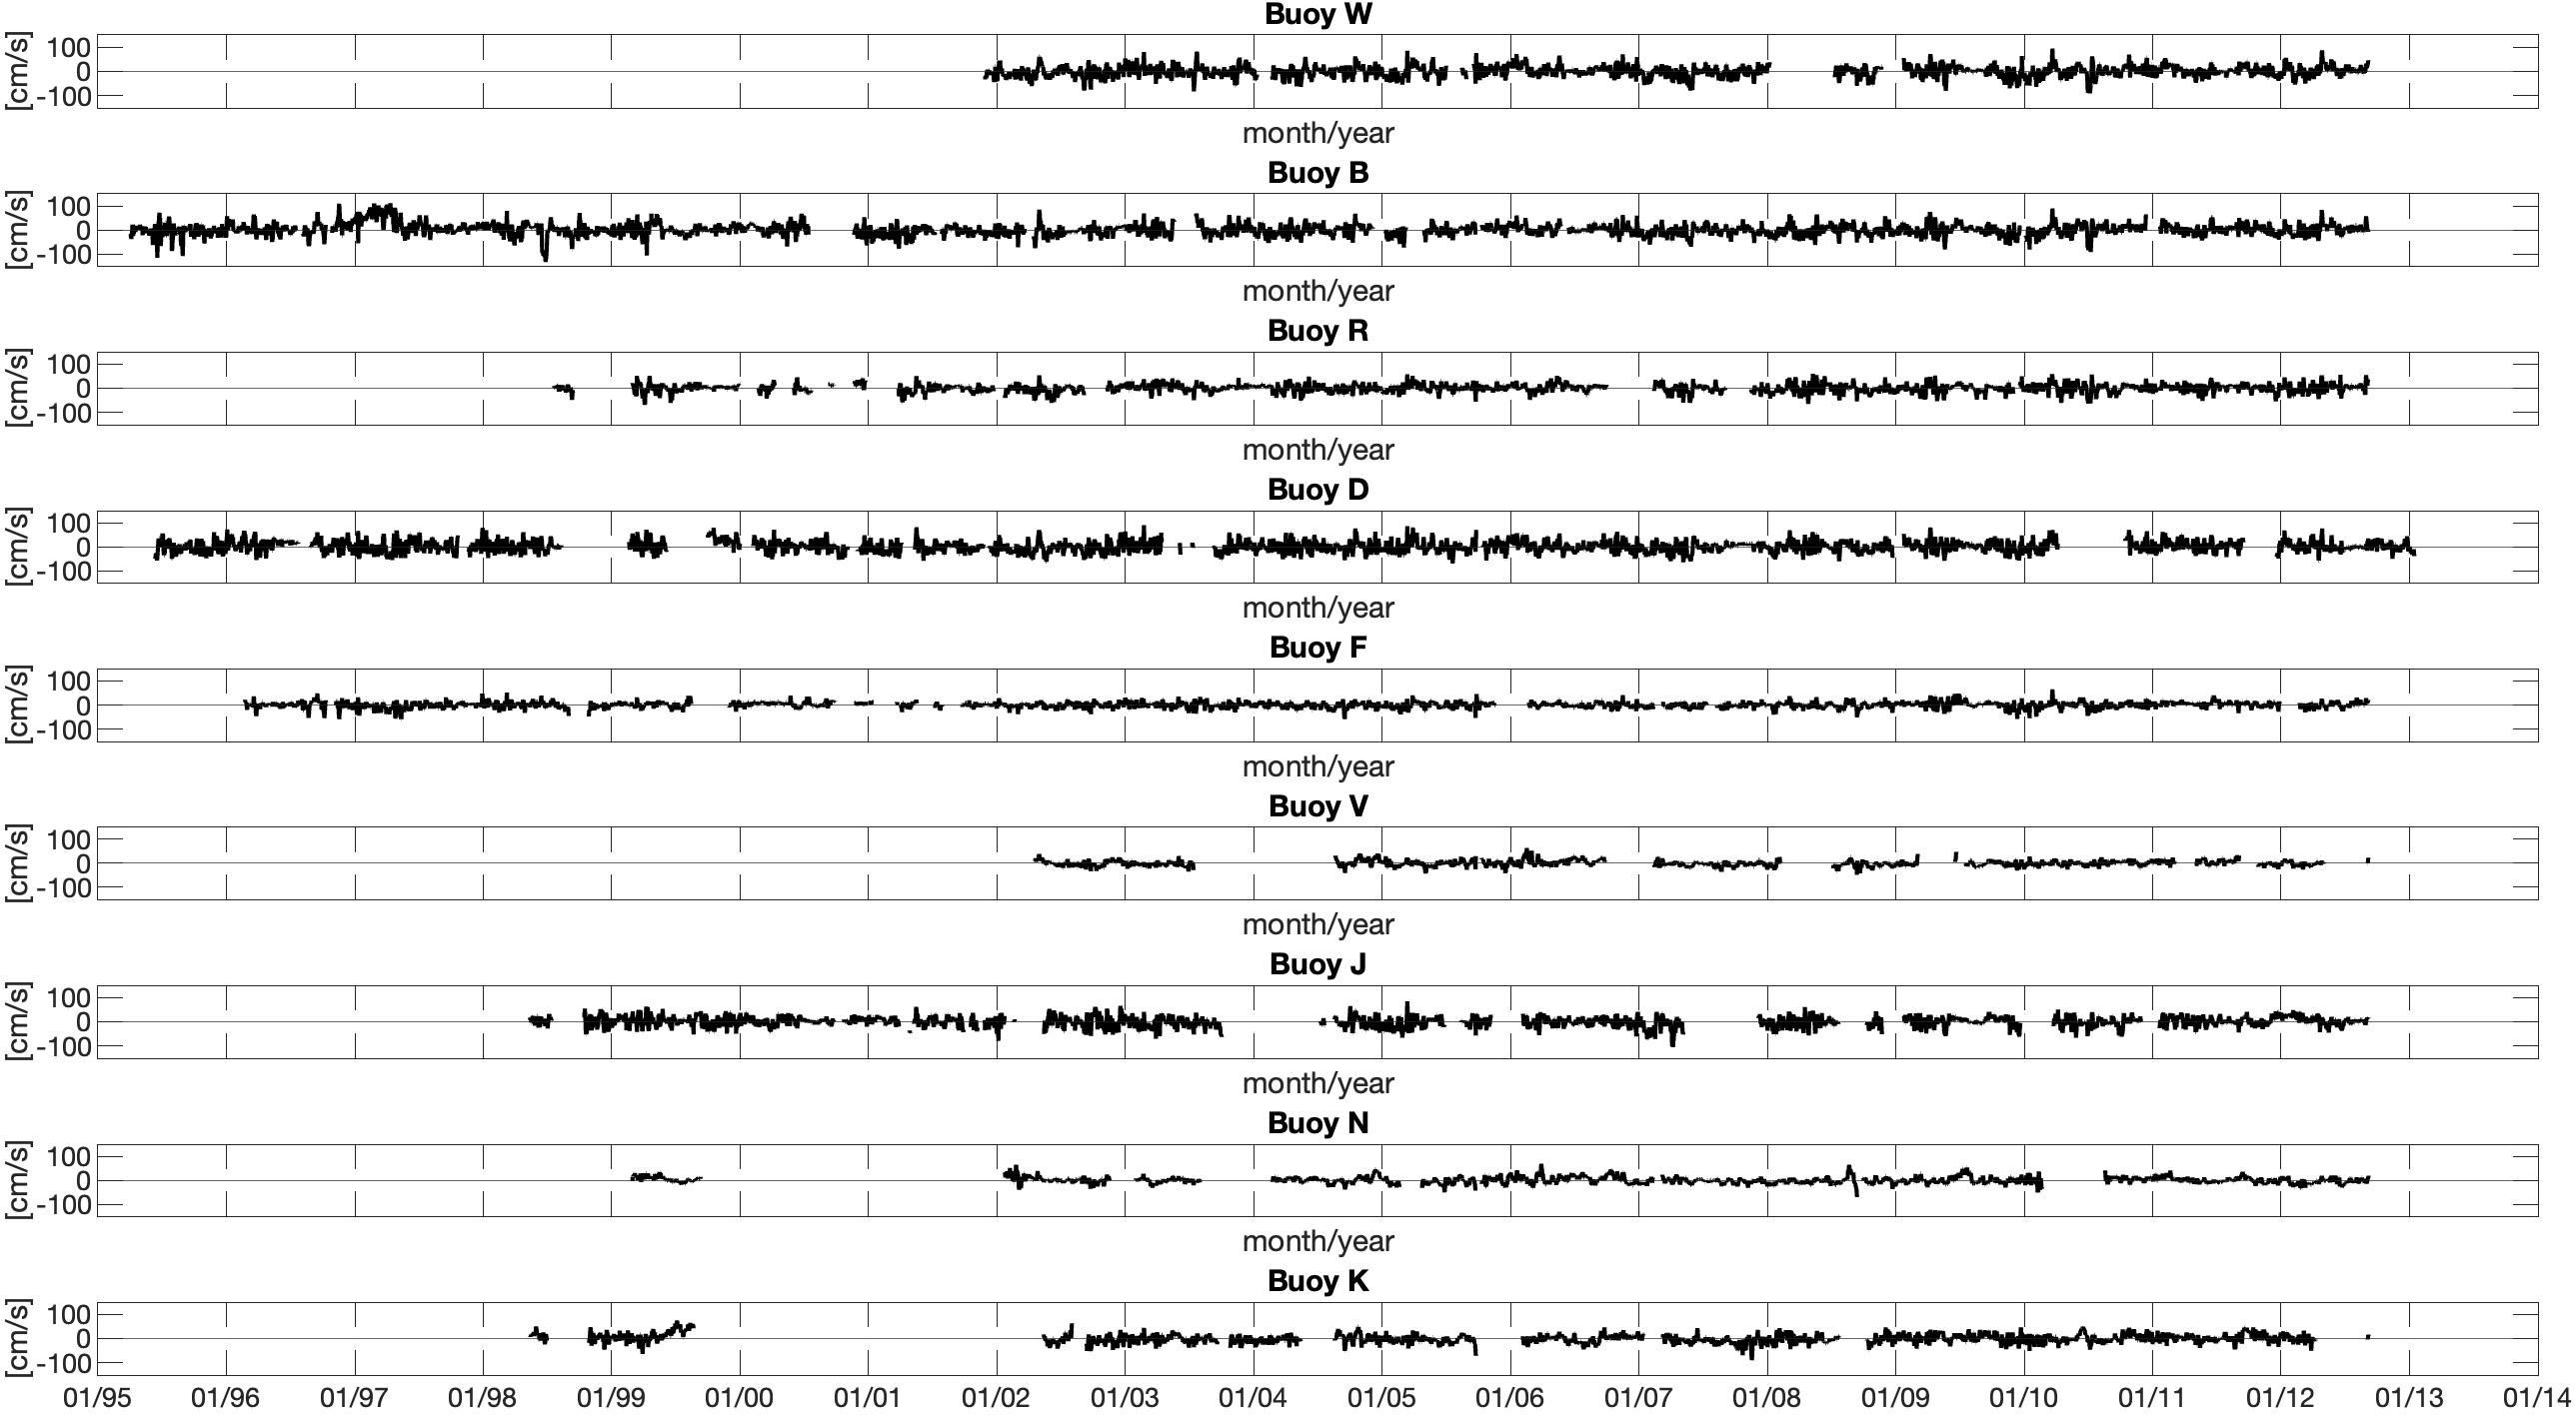
Figure 8
Keywords: Texas Coastal Current, upcoast and downcoast current, wavelet analysis, cross correlation, hurricane, current reversal and persistence
Citation: Nwankwo UC, DiMarco SF, Nowak HM, Whilden K, Buckingham B, Walpert J and Knap AH (2023) Characterizing the weather band variability of the Texas shelf current. Front. Mar. Sci. 10:1221120. doi: 10.3389/fmars.2023.1221120
Received: 11 May 2023; Accepted: 13 October 2023;
Published: 03 November 2023.
Edited by:
Weifeng (Gordon) Zhang, Woods Hole Oceanographic Institution, United StatesReviewed by:
Jiabi Du, Texas A&M University at Galveston, United StatesYonggang Liu, University of South Florida, United States
Copyright © 2023 Nwankwo, DiMarco, Nowak, Whilden, Buckingham, Walpert and Knap. This is an open-access article distributed under the terms of the Creative Commons Attribution License (CC BY). The use, distribution or reproduction in other forums is permitted, provided the original author(s) and the copyright owner(s) are credited and that the original publication in this journal is cited, in accordance with accepted academic practice. No use, distribution or reproduction is permitted which does not comply with these terms.
*Correspondence: Uchenna Nwankwo, Uchenna.nwankwo@tamu.edu