Full Text
Introduction
In the United States alone, hurricanes have been responsible for thousands of deaths and over US$1 trillion in damages since 1980 (https://www.ncdc.noaa.gov/billions/). These impacts are significantly greater globally, particularly in regions with limited hurricane early warning systems and where large portions of the population live at or near sea level. The high socioeconomic impacts of tropical cyclones will increase with a changing climate, rising sea level, and increasing coastal populations. To mitigate these impacts, efforts are underway to improve hurricane track and intensity forecasts, which drive storm surge models and evacuation orders and guide coastal preparations. Hurricane track forecasts have improved steadily over past decades, while intensity forecasts have lagged until recently (Cangialosi et al., 2020). Hurricane intensity changes are influenced by a combination of large-scale atmospheric circulation, internal storm dynamics, and air-sea interactions (Wadler et al., 2021, and references therein).
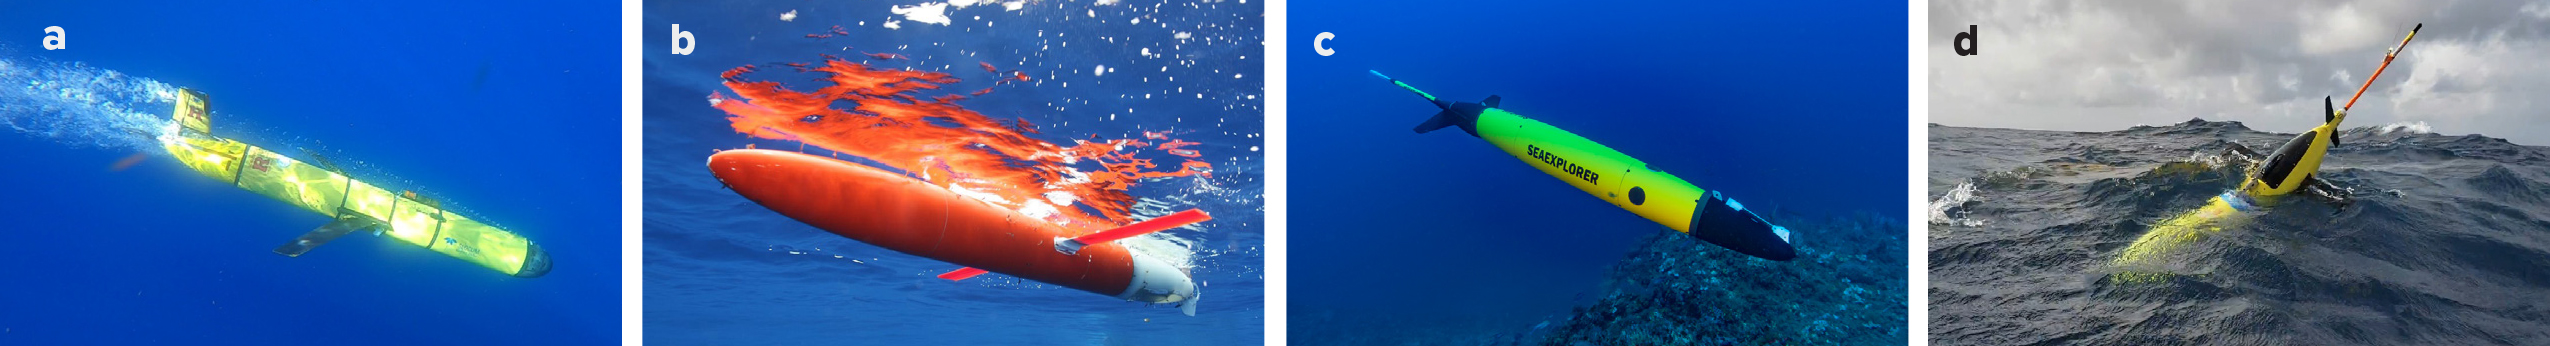
Components of the sustained ocean observing system (e.g., profiling floats, expendable bathythermographs, drifters, moorings) are useful for understanding the role of the ocean in hurricane intensity changes. However, gaps in the ocean observing system, particularly collection of data near the air-sea interface and in coastal regions, boundary currents (e.g., the Gulf Stream, Kuroshio, among others), and areas with complex currents and seafloor topography (e.g., the Caribbean Sea), have led to difficulties in accurately representing upper ocean features and processes in numerical ocean models. Employment of uncrewed ocean observing platforms has begun to fill these gaps by offering rapid relocation and adaptive sampling of regions and ocean features of interest. These platforms include autonomous underwater gliders (Figure 1; Testor et al., 2019) and surface vehicles (Meinig et al., 2019). Uncrewed surface vehicles (USVs), such as saildrones and wave gliders, are systems designed for data collection in hazardous conditions. Data collected by these platforms have improved our understanding of upper ocean temperature and salinity stratification and mixing processes and are becoming critical in improving operational ocean and coupled air-sea hurricane forecast models (Domingues et al., 2021).
|
|
This paper provides a broad overview of the ongoing US hurricane glider project and details of a new effort with the Saildrone USV during the 2021 hurricane season. While this article focuses on the US East Coast, Gulf of Mexico, and Caribbean Sea, similar efforts are underway in Korea, the Philippines, Japan, and China, among other countries.
The Ocean and Hurricanes
The ocean influences hurricane development through the transfer of heat and momentum across the air-sea interface (Le Hénaff et al., 2021; Wadler et al., 2021, and references therein). Warm sea surface temperatures are conducive to hurricane intensification while cool temperatures often lead to weakening. Research shows that upper ocean temperature and salinity ahead of and during hurricanes can evolve rapidly (Glenn et al., 2016). The evolution of the upper ocean depends on various factors, including wind speed and direction, wave state, upper ocean stratification, and interactions with the coastal ocean, among others. To accurately forecast hurricane intensity in the western Atlantic, coupled ocean and atmosphere operational forecast models must resolve large-scale warm ocean currents (e.g., the Gulf Stream, the Gulf of Mexico Loop Current, and their associated meanders and eddies; Todd et al., 2018); freshwater layers from large rivers such as the Amazon-Orinoco and Mississippi (Domingues et al., 2021), which can inhibit ocean mixing and maintain warm upper ocean temperatures ahead of storms; and shallow continental shelf features like the Mid-Atlantic Cold Pool, a cold bottom water mass that can rapidly mix to the surface and weaken storms before landfall (Glenn et al., 2016). New technologies such as uncrewed ocean gliders and surface vehicles, alongside more established components of the Global Ocean Observing System (e.g., Argo floats, air-launched expendable bathythermographs, and satellite sensors), will improve existing hurricane forecast and warning systems and support critical research to develop the next generation systems.
Underwater Gliders
Gliders (Figure 1) have emerged as a major component of US and international multi-hazard warning systems. Since 2014, the operation of gliders for hurricane research and forecasts has been a joint effort by the US National Oceanic and Atmospheric Administration (NOAA), the US Integrated Ocean Observing System (IOOS) Regional Associations, academic institutions, the US Navy, the National Science Foundation, private companies, and other regional and international partners. Gliders are unique in their maneuverability, able to profile through the water column as deep as 1,000 m with vertical and horizontal speeds of ~10–20 cm/s and ~25 cm/s, respectively. Standard glider sensor packages include temperature, salinity, and density, while some gliders also collect profiles of water speed and direction. Biogeochemical measurements can include oxygen, phytoplankton, and particle concentration for water quality assessment. Numerous advanced sensor packages continue to be developed and integrated. Gliders can collect data as frequently as every two seconds, providing submeter-scale measurements in the vertical, though lower sample rates are typically used to conserve power and minimize surface time.
While opportunistic glider deployments were carried out for hurricane research in the first decade of this century, coordinated regional fleets were first used for hurricane research and operational model development in 2014. These experiments were supported by the congressionally authorized Disaster Recovery Act following the devastation of Superstorm Sandy in October 2012. Studies from this time period (Glenn et al., 2016; Domingues et al., 2021, and references therein) demonstrated the unique capabilities of gliders to contribute to our understanding of ocean feedbacks on hurricane intensity and to the improved accuracy of coupled hurricane model forecasts.
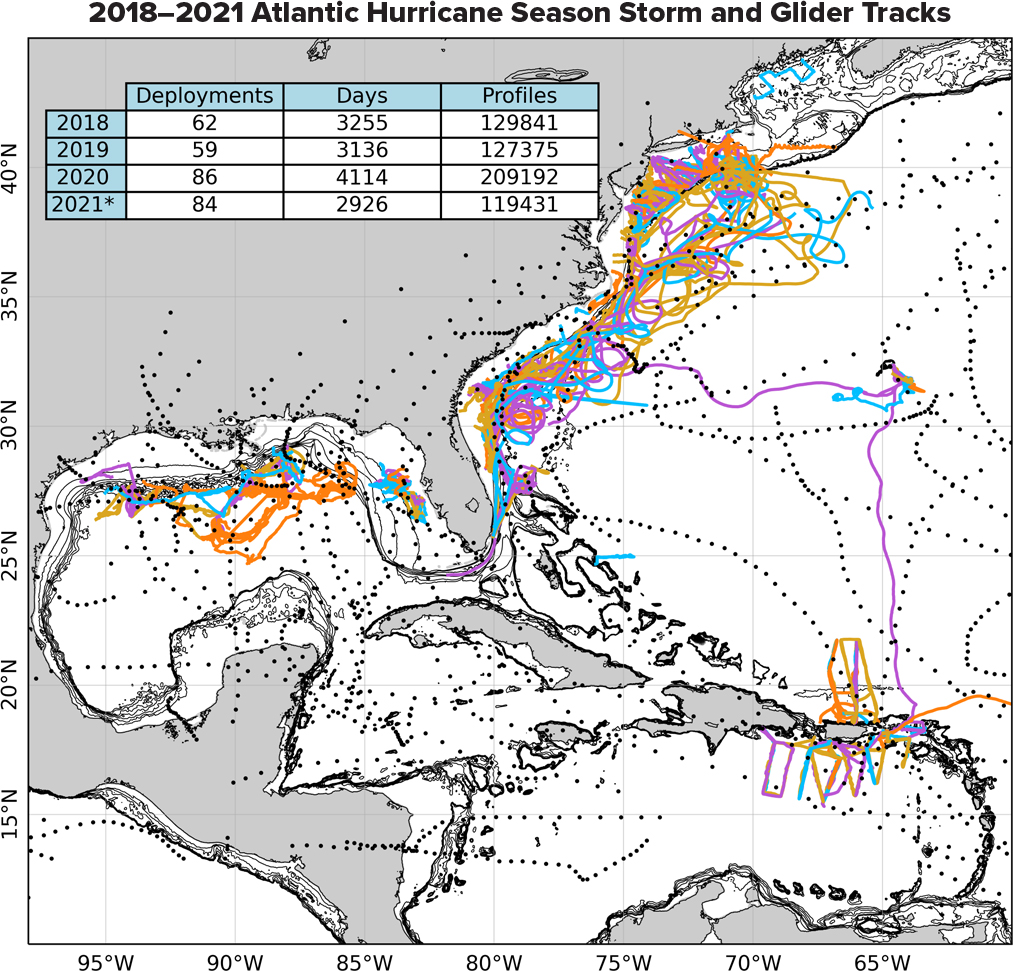
Following the coastal impacts of Hurricanes Irma and Maria in 2017, large multi-institution fleets of gliders have now been deployed to collect data. These efforts, and other leveraged glider observations, have resulted in over 280 deployments, collecting nearly 600,000 ocean profiles during 13,000 glider days in hurricane seasons from 2018 to 2021 in the open Atlantic Ocean, the Caribbean Sea, the Gulf of Mexico, and off the US East Coast (Figure 2). These gliders were strategically deployed in regions with high probabilities of hurricane passage, near ocean features that impact hurricane intensity, and near vulnerable coastal population centers.
|
|
Gliders have collected data in the ocean under more than 30 Atlantic tropical cyclones. These data are provided to the publicly accessible IOOS Glider Data Assembly Center (DAC; https://gliders.ioos.us), where they are accessed in real time and distributed through the World Meteorological Organization Global Telecommunication System (GTS). This distribution pathway allows NOAA to access the glider profiles for assimilation into the operational numerical models, such as the global Real Time Ocean Forecast System, used to initialize the ocean component of coupled hurricane forecast models such as the NOAA Hurricane Weather Research and Forecasting model.
A data impact study of Hurricane Maria (2017) showed that, out of the suite of in situ ocean observing platforms, glider data locally generate the largest error reduction in intensity forecasts within NOAA operational forecast models (Domingues et al., 2021). Additional model improvements were achieved when glider data were used alongside other ocean observations (Halliwell et al., 2020). Gliders have also contributed to new understanding of
hurricane-forced coastal ocean circulation (Glenn et al., 2016), impacts on boundary currents (Todd et al., 2018), ahead-of-eye mixing processes (Glenn et al., 2016), and impacts of these processes on hurricane intensity. With the development of new sensors and public data repositories, gliders additionally contribute to the understanding of regional ecosystems, fisheries, water quality, harmful algal blooms, ocean warming and climate change, and renewable energy, among other coastal processes, stressors, and solutions.
A New Uncrewed Surface Vehicle for Hurricane Operations and Research
To continue making significant progress toward understanding and predicting hurricane intensity changes, new technologies are being tested to provide improved estimates of air-sea fluxes in a hurricane environment. Efforts by public-private partnerships have rapidly advanced development of USVs into air-sea interaction observing platforms (Meinig et al., 2019). The use of renewable wind, surface wave, and solar energy for propulsion and instrumentation has increased USV endurance up to 12 months and enabled installation of more sensors (Zhang et al., 2019). Specifically, Saildrone USVs (Figure 3) are equipped with 15 sensor packages that measure 22 essential ocean and climate variables, such as sea surface temperature, salinity, oxygen, wave height and period, near-surface winds, air temperature, relative humidity, solar and longwave radiation, and barometric pressure (Zhang et al., 2019).
|
|
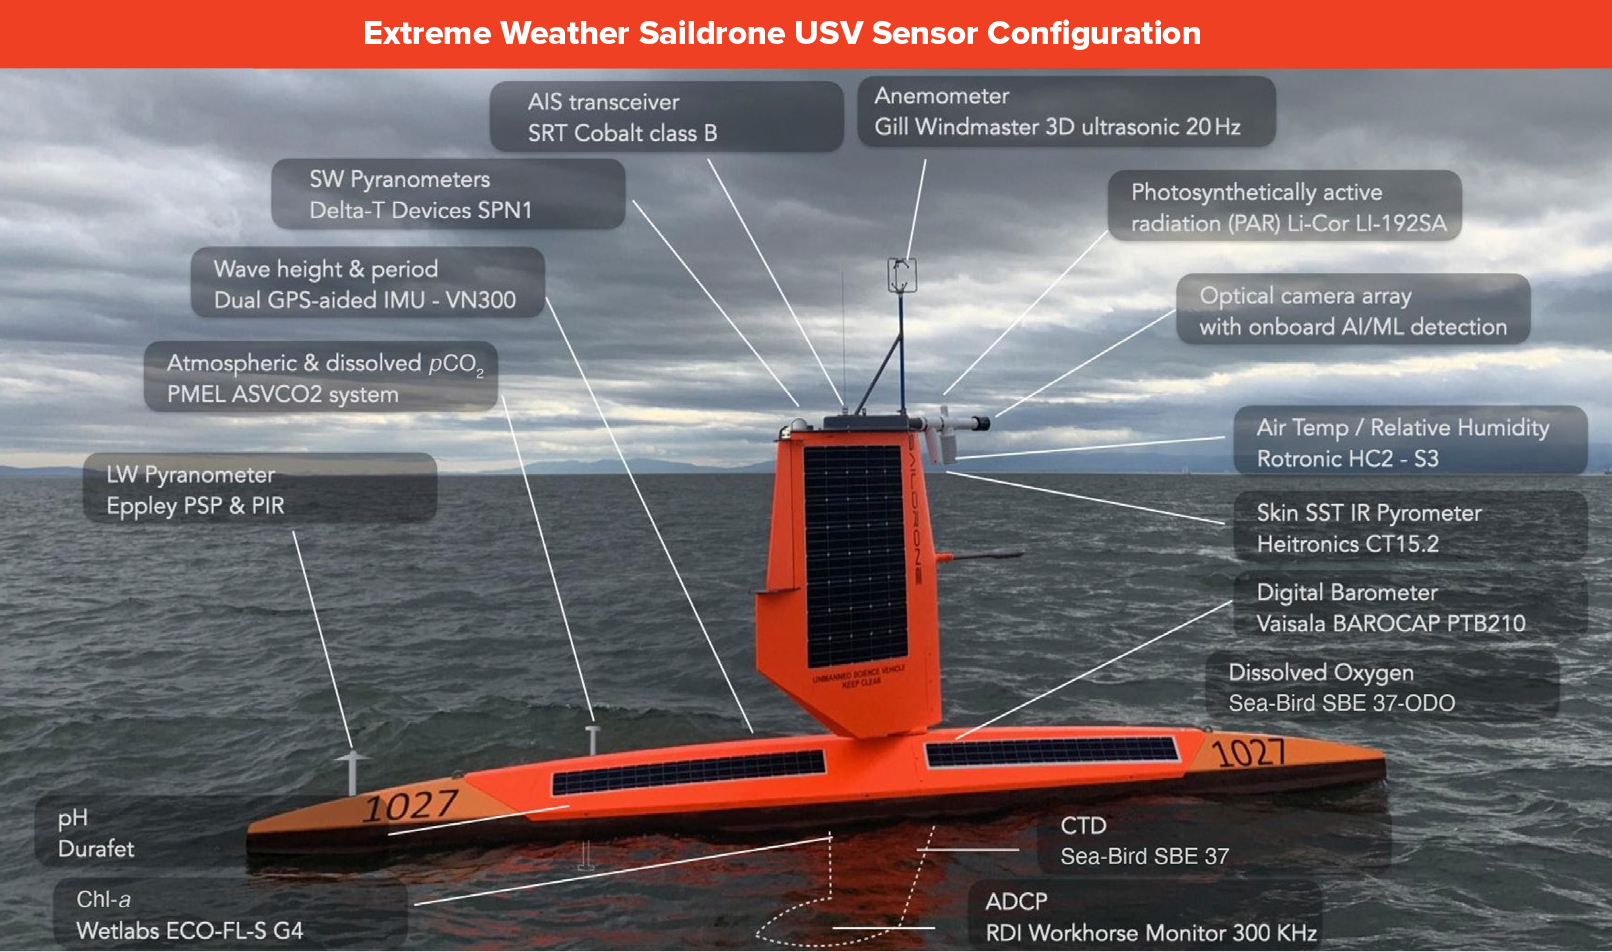
During the 2021 hurricane season, NOAA supported for the first time deployment and operation of five specially designed Saildrone USVs to measure air-sea interaction in regions where Atlantic tropical cyclones occur frequently. Compared to conventional Saildrone platforms, these extreme weather systems have shorter wings for increased stability, allowing them to operate in hurricane-force winds and in the presence of large breaking waves (Figure 3). For the 2021 mission, the five extreme weather Saildrone USVs were strategically located in regions of the western tropical Atlantic, the Caribbean, and near the US East Coast to maximize the probability of encountering at least one hurricane or tropical storm. The USVs continuously measured properties in the near-surface atmosphere and ocean and transmitted one-minute averaged data to the GTS and data centers in real time for assimilation into forecast models and for other public use.
The extreme weather Saildrone USVs travel at speeds of about 30–150 km per day, depending on winds and currents, and can be directed to locations directly in tropical cyclone paths. For example, during the 2021 mission, Saildrone SD-1031 traveled 35 km to the east during the 24 hours before the arrival of Hurricane Henri, bringing it within 50 km of the eye of the storm. The ability to move the USV into storm paths increases the chances of acquiring ocean-atmosphere measurements in high-wind conditions. These measurements are extremely valuable because the rates of heat and momentum exchange between the ocean and tropical cyclones, and storm dependence on the states of the ocean and atmosphere, are not well known, in part because there are so few measurements. The highlight of the mission was the passage of Category 4 Hurricane Sam directly over Saildrone SD-1045 on September 30 (Figure 4), when winds up to 56 m/s (at a height of 5 m) and waves as high as 14 m were recorded in the hurricane’s northern eyewall. Saildrone SD-1045 then traveled across the eastern edge of the eye and through the southern eyewall, recording the first-ever video from the sea surface of the eyewall of a major hurricane (https://www.saildrone.com/press-release/ocean-drone-captures-video-inside-category-4-hurricane).
|
|
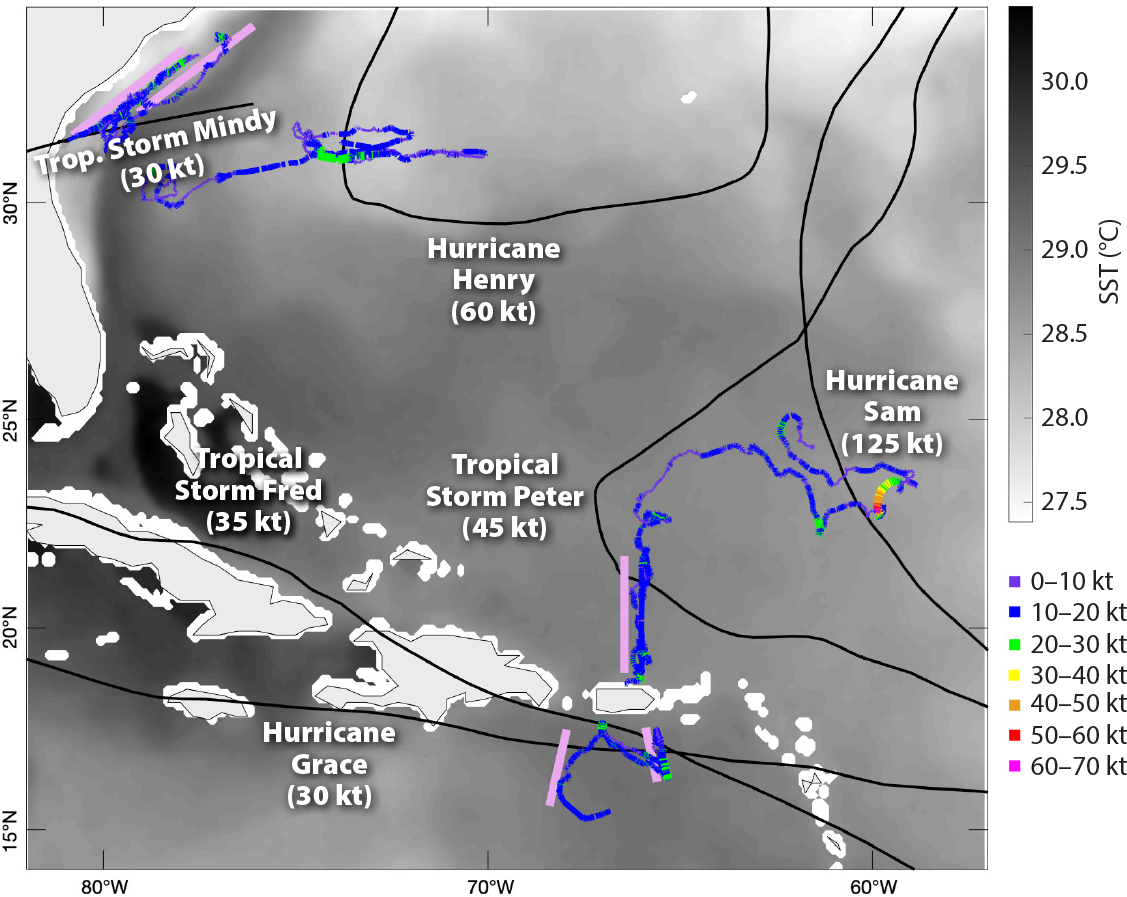
During the August–October 2021 Atlantic hurricane mission, two other tropical storms passed close to saildrones: Grace passed directly over Saildrone SD-1048 south of Puerto Rico, and Fred passed about 140 km to the north of the same saildrone. When they were not being directed toward tropical cyclones, the mission scientists worked with Saildrone Inc. pilots to keep four of the Saildrone USVs close to gliders to obtain nearly collocated measurements of the upper ocean and near-surface atmosphere (Figure 4). In addition, NOAA’s hurricane reconnaissance aircraft acquired collocated profiles of atmospheric temperature, humidity, and winds from dropsondes together with ocean temperature profiles collected from air-launched expendable bathythermographs in Hurricane Henri. NASA aircraft also launched dropsondes near some of the Saildrone USVs during its Convective Processes Experiment–Aerosols & Winds (CPEX-AW) field campaign. These unique data sets will be valuable for advancing knowledge of interactions between the subsurface ocean and tropical cyclones.
Conclusions
Both autonomous underwater gliders and uncrewed surface vehicles such as saildrones represent advanced ocean observing technologies that are revolutionizing both our understanding of and ability to forecast hurricane track and intensity. To realize their full potential, these technologies will continue to be more closely integrated with established regional and global ocean and atmosphere observing platforms. One of the main objectives of these projects during the 2021 Atlantic hurricane season was to obtain collocated and simultaneous measurements of the upper ocean and air-sea coupling within a hurricane. These combined observations will provide new insights into the coevolution and coupling of the ocean and atmosphere to better predict storm intensity. Future hurricane observations should encourage more closely coordinated deployments of underwater, near-surface, and airborne observations in order to better understand rapid hurricane intensity changes. As ocean, atmosphere, and coupled model architecture and data assimilation capabilities continue to coevolve and improve, these observing systems and their shoreside cyberinfrastructure will become critical components of operational forecasting systems in the United States.
ACKNOWLEDGMENTS