Full Text
Multiple stressors are affecting the Pacific Northwest (PNW) coastal ocean, including harmful algal blooms (HABs), ocean acidification, marine heatwaves, and hypoxia (low oxygen). While these conditions or events are tied to seasonal cycles such as upwelling periods and multiyear cycles such as El Niño/La Niña, they are becoming increasingly frequent and intense. Additionally, they can have devastating impacts on ecosystem health and human well-being, shutting down fisheries, stifling the local economy, threatening food security, and inhibiting cultural practices. For example, increasing ocean acidification has affected shellfish growers’ capability to secure reliable product. In 2015, a HAB associated with a marine heatwave shut down crab fisheries from Alaska to Baja for commercial and tribal fishers (McCabe et al., 2016), a closure so impactful that the US Congress included the Fishery Disaster Relief Program for Tribal Fisheries in the Budget Act of 2018. And, an unpredicted hypoxia event in 2015 resulted in the Quinault Indian Nation pulling up crab pots with dead crab. Regional projections indicate increases in warming, ocean acidification, and hypoxia by the end of the century (Siedlecki et al., 2021), so solutions are needed.
The challenge of multi-stressor impacts can be addressed by engaging a variety of partners to collect multi-variable observing and forecast data while increasing both scientific knowledge and application of data and information to real-world needs. The Northwest Association of Networked Ocean Observing Systems (NANOOS, http://www.nanoos.org/) helps sustain long-term observations and forecast models to help communities adapt to and plan for variable and changing ocean conditions, thus increasing resilience. NANOOS is the PNW regional coastal ocean observing system of the US Integrated Ocean Observing System (IOOS). It was recently designated a nexus organization for the UN Decade of Ocean Science for Sustainable Development because of its work to sustain and integrate ocean observations and modeling to produce publicly accessible regional data products that help diverse coastal communities ensure safety, build economic resilience, and increase understanding of the coastal ocean.
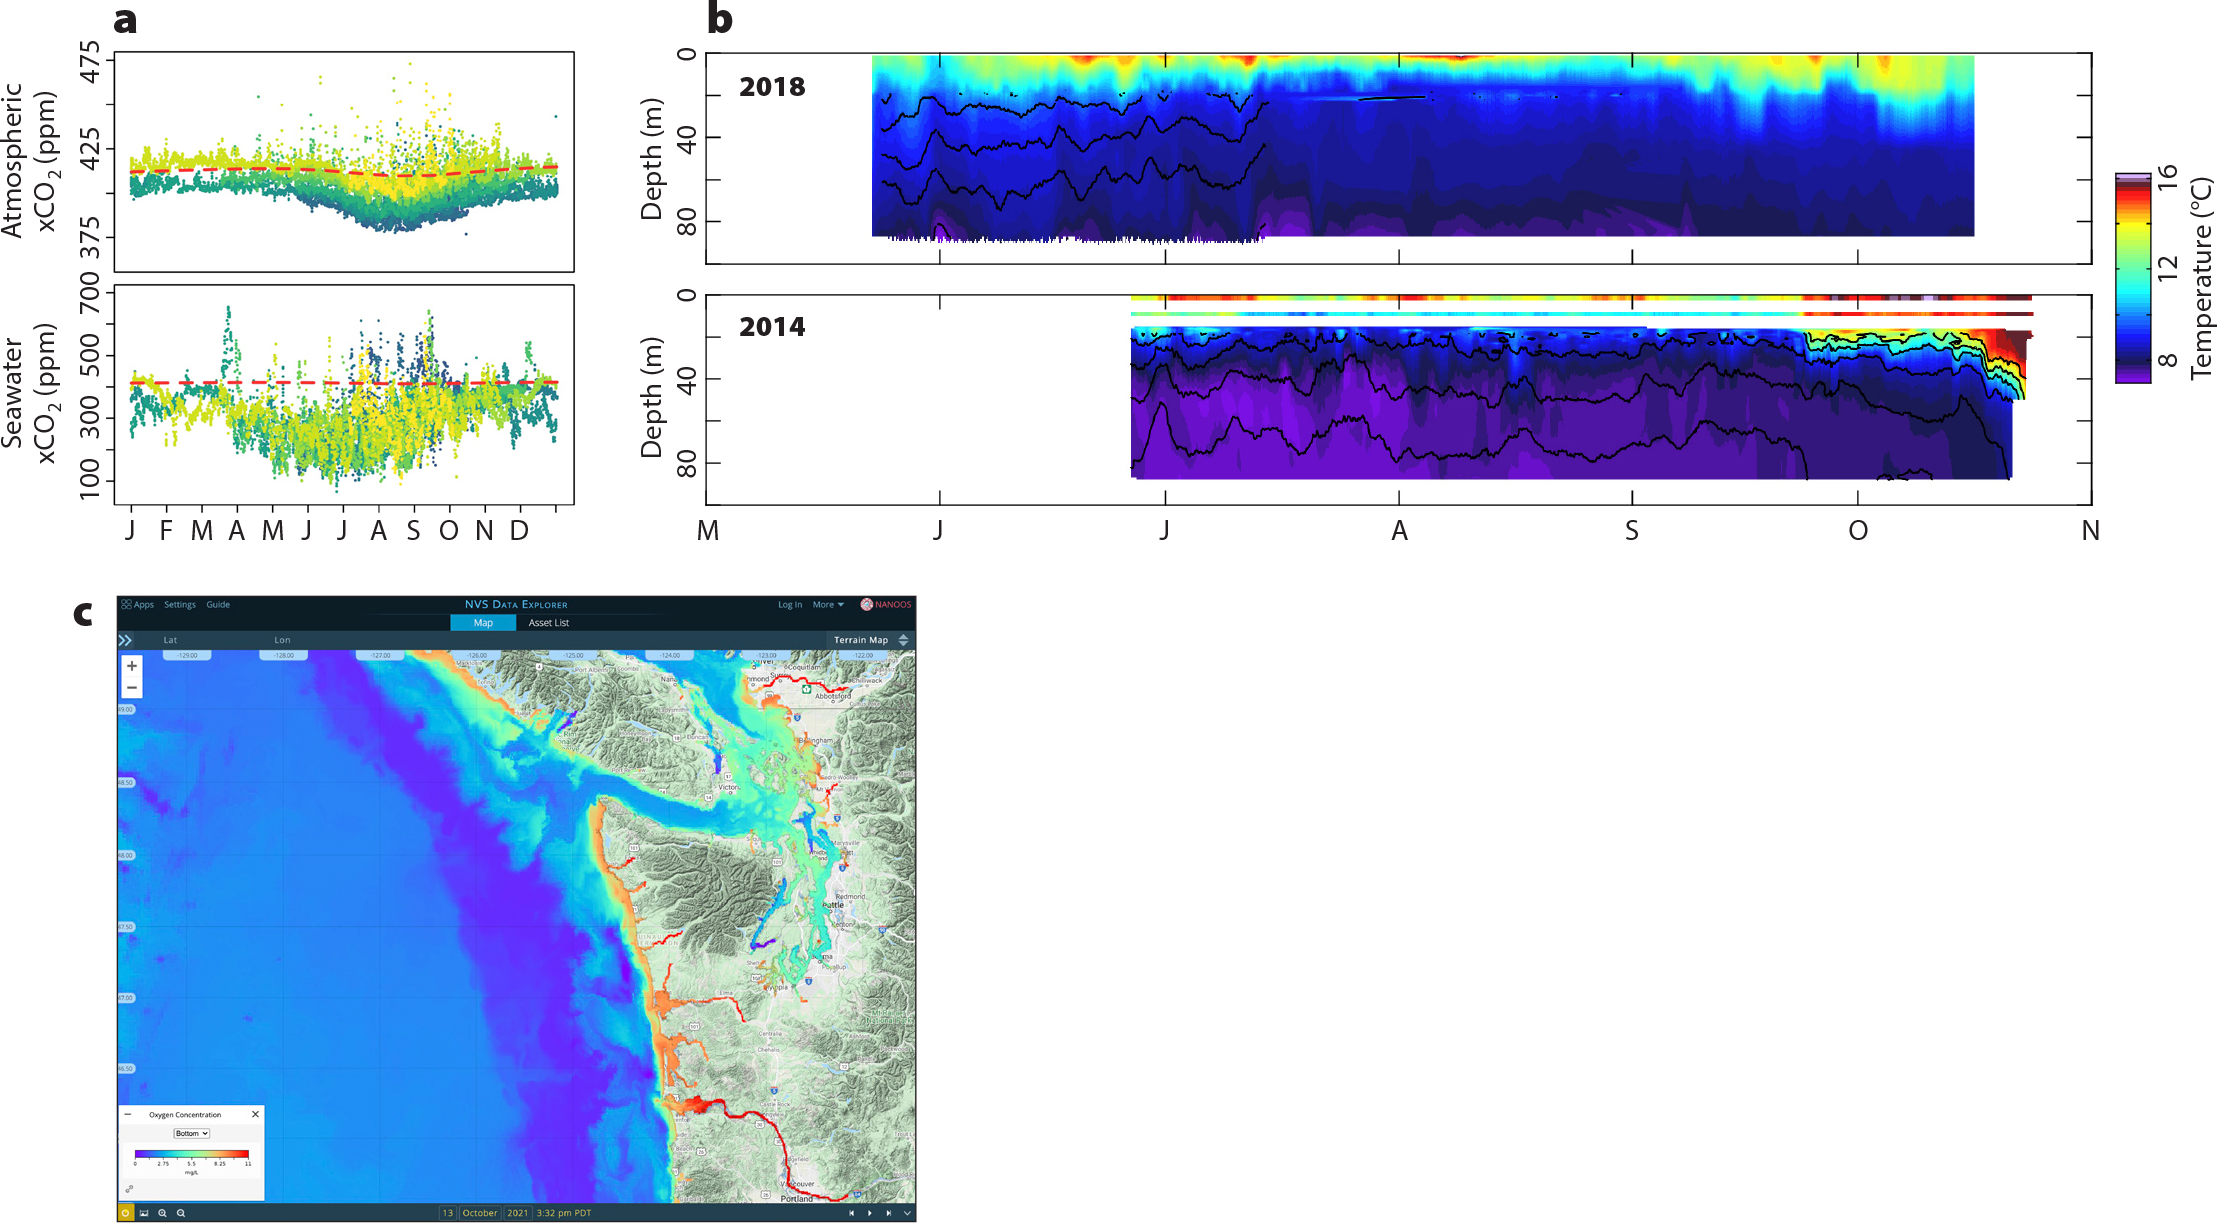
NANOOS, in collaboration with regional partners, provides observations of temperature, salinity, oxygen, chlorophyll, carbon dioxide, pH, and HABs from buoy assets off the PNW coast (Figure 1). These observations also support several models such as LiveOcean, which provides 72-hour projections of ocean variables such as temperature, salinity, oxygen, and pH. Another model, J-SCOPE, forecasts these conditions six to nine months out. Collectively, data and model outputs are being used by researchers to increase our scientific understanding of coastal dynamics, including HABS, ocean acidification, hypoxia, and marine heatwaves.
|
|
This expanding scientific knowledge is a foundation upon which data products are built to aid effective resource management, maritime safety, and other public uses. Data from NANOOS and other federal, academic, tribal, state, and regional programs are integrated and served via tailored data products or applications on the NANOOS Visualization System (NVS), which is freely available to the public and supports a diversity of users. State and tribal resource managers actively use NVS and other NANOOS products to inform decisions on whether to open a beach for clamming or defer crabbing effort. Shellfish growers access information about the present and forecasts of the degree of ocean acidification.
NANOOS assets also provide platforms for testing and developing new technology with partners. With funding from the IOOS Ocean Technology Transition Program and the NOAA National Centers for Coastal Ocean Science, diverse partners deployed a seasonal, real-time HAB-monitoring mooring equipped with an Environmental Sample Processor (ESP), which is an advanced electromechanical fluidics instrument capable of detecting the HAB toxin domoic acid (Moore et al., 2021). ESP observations provide critical information to resource managers via the PNW HAB Bulletin, available on the NANOOS website. Tribal dependency on clam harvest is strong (Figure 2). Further, the contextual observations from adjacent NANOOS moorings have permitted investigation into toxic Pseudo-nitzschia spp. bloom dynamics, including the roles of advection, upwelling, and water property changes. This type of cross-platform analysis can ultimately increase forecast and monitoring effectiveness.
|
|

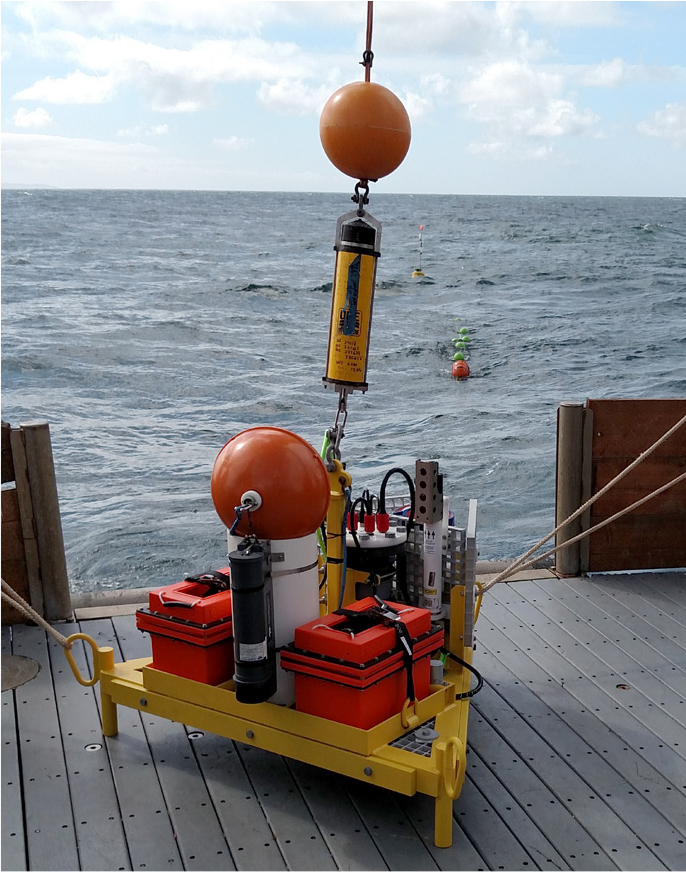
Ocean observing data empower resilience through knowledge. In addition to HABS, hypoxia presents an additional stressor to crab fisheries. The Quileute Tribe utilized funds from the Fishery Disaster Relief Program for Tribal Fisheries to work with the University of Washington Applied Physics Lab to build and deploy two real-time oceanographic moorings that the tribe now owns (Figure 3). The seabed moorings are equipped with oxygen sensors and profiling current meters for detecting hypoxic water and measuring its transport, with near-real-time data served by NANOOS. Deployed in June 2021, these moorings provide critical information to inform harvest decisions and will continue to be a valuable resource to the coastal community.
|
|
The need for reliable and timely ocean information is strongly felt by coastal communities to ensure their safety, livelihood, and provisioning. Partnerships and integrated multi-use data and models offer diverse user groups the information they need for enhancing resilience to climate change. We conclude that through two human qualities—the willingness to partner and the dedication of scientific investigators and technicians (as evidenced by buoy servicing throughout the COVID pandemic)—solutions are being found that increase our collective ability to face these challenges. NANOOS and sister IOOS ocean observing systems were designed to meet society’s needs for coastal resilience based on a strong scientific foundation and technology development. Such partnerships, founded on mutual respect and inclusion, must be sustained into the future.