Last updated August 11, 2020 at 12 PM ET
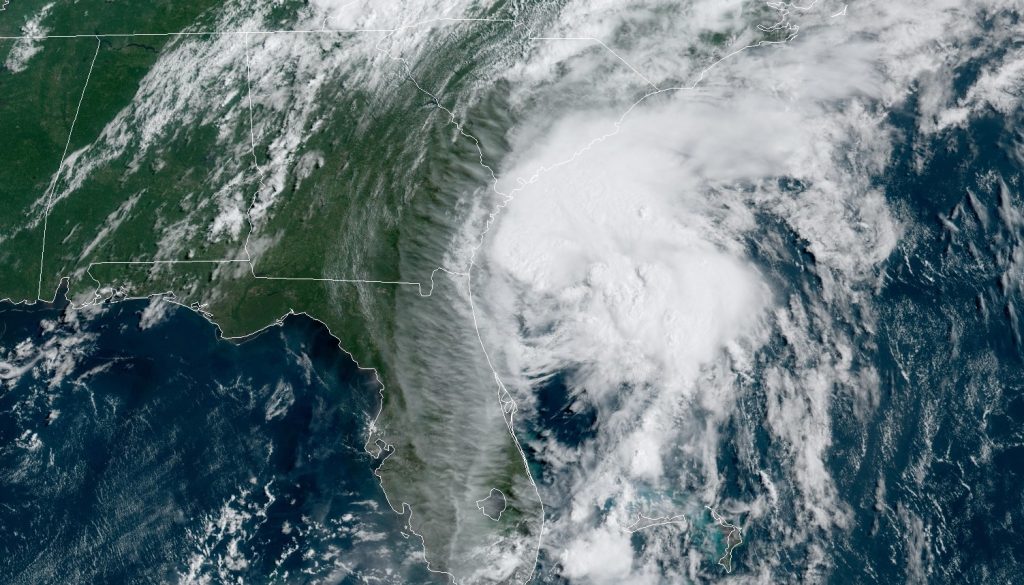
Isaias made landfall as a Category 1 hurricane late Monday night near Ocean Isle Beach, North Carolina. It raced up the East coast, eventually dissipating in Canada.
SECOORA’s team members were prepared for Isaias and collected data as Isaias traveled through the Southeast region.
Hurricane Gliders
SECOORA gliders, Sam and Franklin, were capturing water column information along the southeast coast ahead of and during Isaias. Gliders are autonomous underwater vehicles, often referred to as AUVs, that are remotely operated. They are equipped with sensors that can measure ocean water temperature, salinity chlorophyll a, and more. Data from gliders allows forecasters and scientists to improve predictions of the storm’s potential intensity.
The SECOORA glider Franklin (operated by UGA/SkIO) and the University of South Florida glider Sam were deployed offshore of Cape Canaveral, FL ahead of the storm. Pictured below is ocean water temperature data from Sam. Sam was deployed on July 16 with Franklin following on July 29.
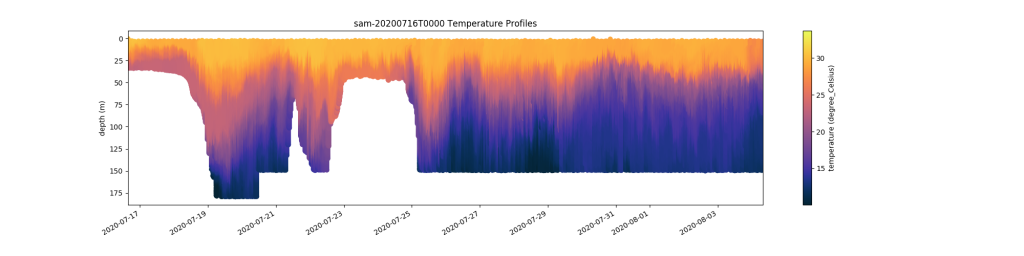

“It is remarkable to have repeated glider sampling missions that track conditions along the outer continental shelf of the South Atlantic Bight and into the Gulf Stream. We are already seeing unexpected things. The gliders operating in the Gulf Stream are being strongly deflected east at the Charleston Bump, which is contrary to the surface current model predictions.
Additionally, the gliders Franklin and Sam recorded pretty cool water temperatures (20C/68F) at depth offshore of Cape Canaveral but the water at depth warmed as the gliders progressed northward. Typically, the models predict colder water at depth and if the models underestimate heat content through the water column then that may translate into intensity errors for hurricane models.” – Dr. Harvey Seim, University of North Carolina Chapel Hill
Click here for Franklin glider data.
Click here for Sam glider data.
Buoy Data
SECOORA supports 9 buoys off the coast of North Carolina and South Carolina that are operated by the University of North Carolina Wilmington’s Coastal Ocean Research and Monitoring Program (UNCW CORMP). In preparation for the storm, CORMP increased the buoy reporting frequency to 15-minute intervals for CAP2, FRP2, SUN2, and ILM2. NOAA National Weather Services offices in Wilmington, NC and Charleston, NC were notified of the increased data availability.
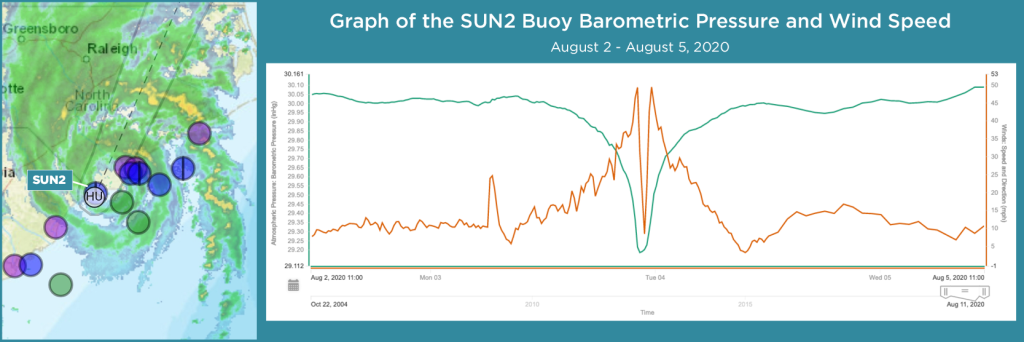
The eye of Isaias went directly over SUN2 on the evening of Tuesday August 4. The buoy did not get damaged and is still reporting data.
The above is a graph of barometric pressure and wind speed collected by SUN2. You can see the barometric pressure and wind speed decrease as the eye of Isaias moved over SUN2.
Click here for all UNCW CORMP buoy data.
Click here for SUN2 data view.
Following the Data
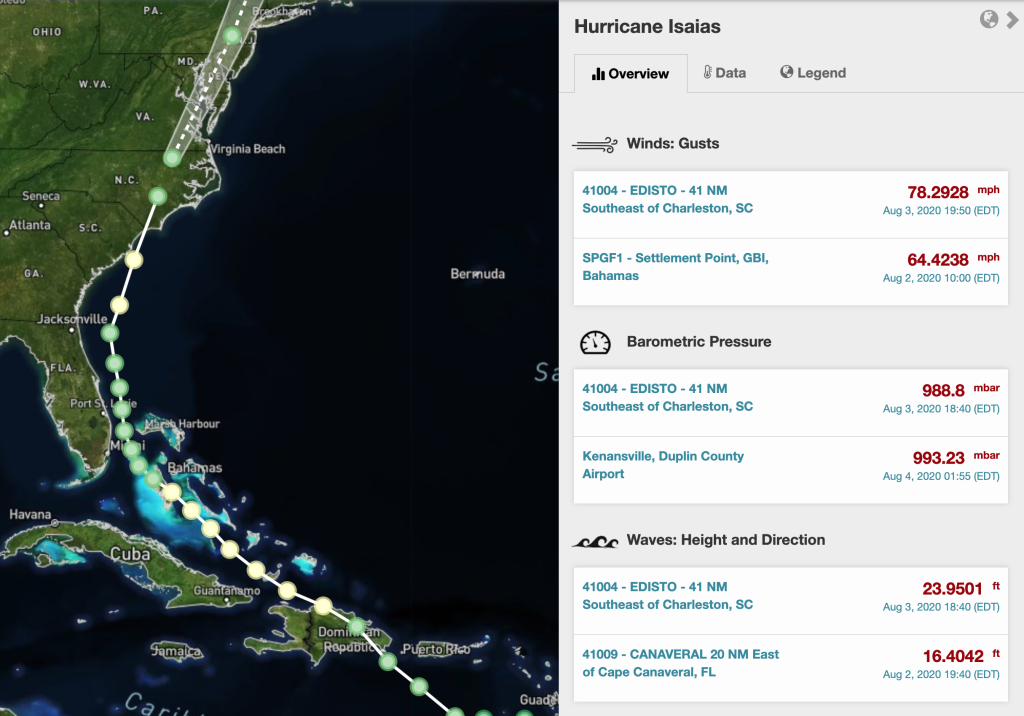
Eyes on the Storm pulls data from within 50 miles of Isaias path. In the Southeast region, NBDC Buoy 41004 – Edisto – captured the highest wind gusts, highest wave heights, and lowest barometric pressure. Isaias was a category 1 hurricane when traveling over buoy 41004.
Studying Coastal Change
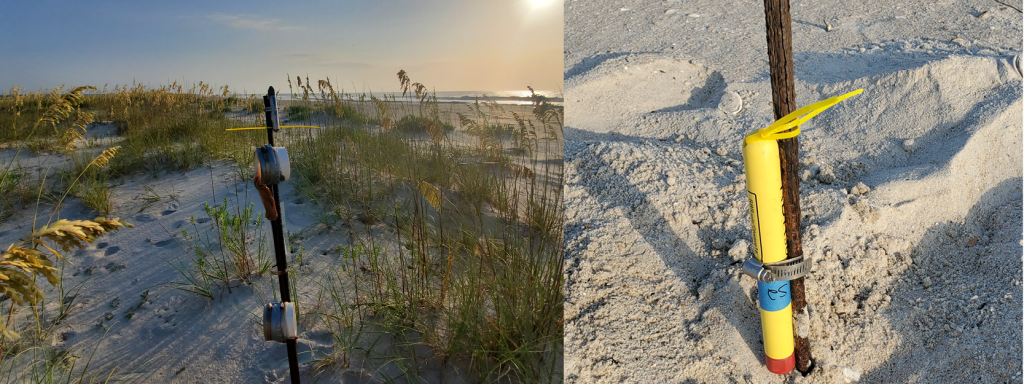
On Saturday August 1, lead researcher Joseph Long from UNCW and his team deployed water level sensors and sediment traps on Masonboro Island, an uninhabited barrier island off of Wilmington, NC. The sensor deployments are part of a larger UNCW project that started in 2018 to study the impact of storms, like Isaias, on barrier islands. Researchers on the project have been conducting bi-monthly surveys for the past two years to also look at the importance and timescale of natural recovery along barrier islands between storms.
Related news
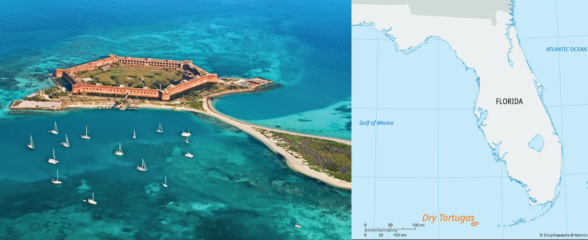
New High Frequency Radar at the Dry Tortugas National Park Improves Ocean Surface Current Measurements Across the Straits of Florida
A new CODAR Low-Power SeaSonde HFR has been deployed by the University of South Florida at Fort Jefferson on Garden Key to measure surface currents to improve understanding and prediction of the Gulf of Mexico Loop Current.
President Biden Proposes Significant Budget Cuts to IOOS for 2025
President Biden’s recent 2025 budget proposal slashed the funding allocated for the Integrated Ocean Observing System (IOOS) by 76%, which would effectively shut down coastal and ocean observing efforts.
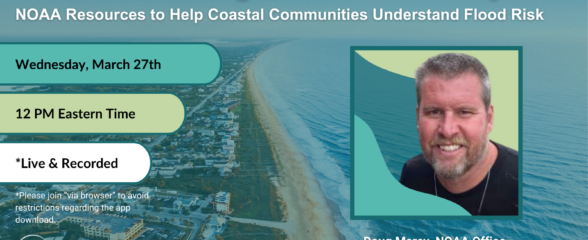
Webinar: NOAA Resources to Help Coastal Communities Understand Flood Risk
Join us Wednesday, March 27th at 12 PM Eastern Time for SECOORA's Coastal Observing in Your Community Webinar Series to hear from Doug Marcy with the NOAA Office for Coastal Management.