
Figures & Infographics
Looking for infographics?
View Infographics
Figures
These figures from the Dietary Guidelines for Americans, 2020-2025 are provided for you to download and use. Please see the permission to use statement at the bottom of this page for additional questions. ¿Estás buscando figuras en español? Visita nuestra página de Figuras en español.
Explore the figures on this page using the buttons below
General
Figures Nutrient
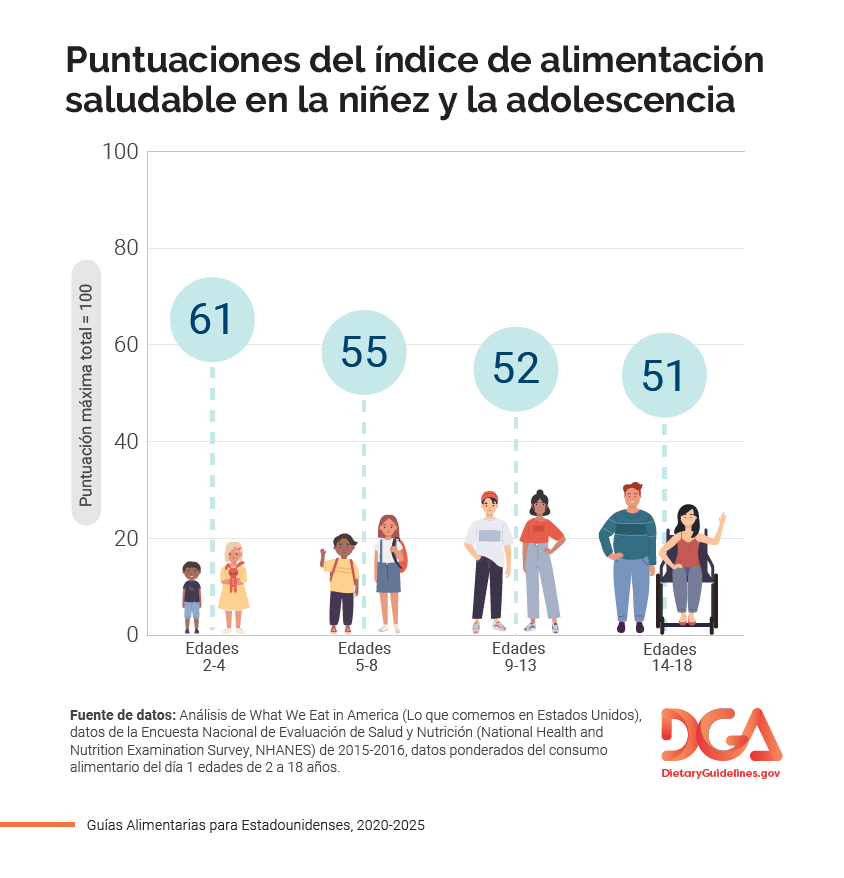
Density Healthy
Eating Index Dietary
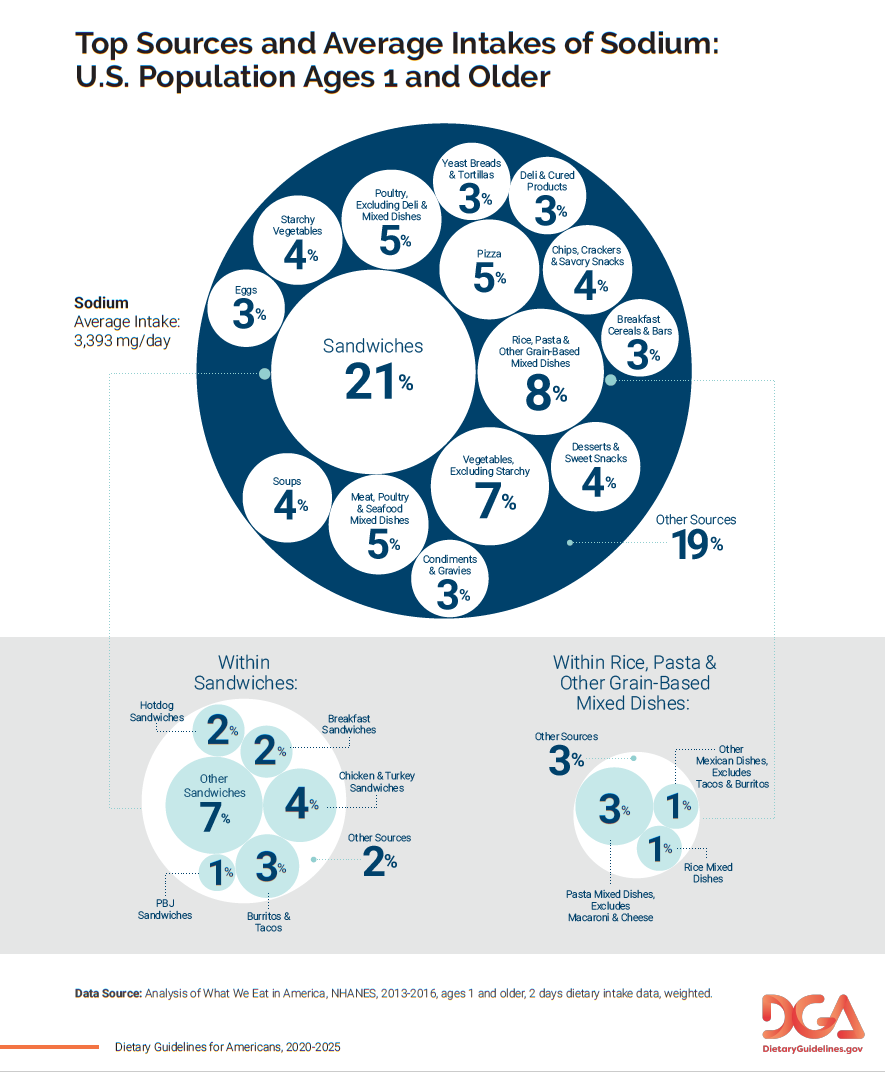
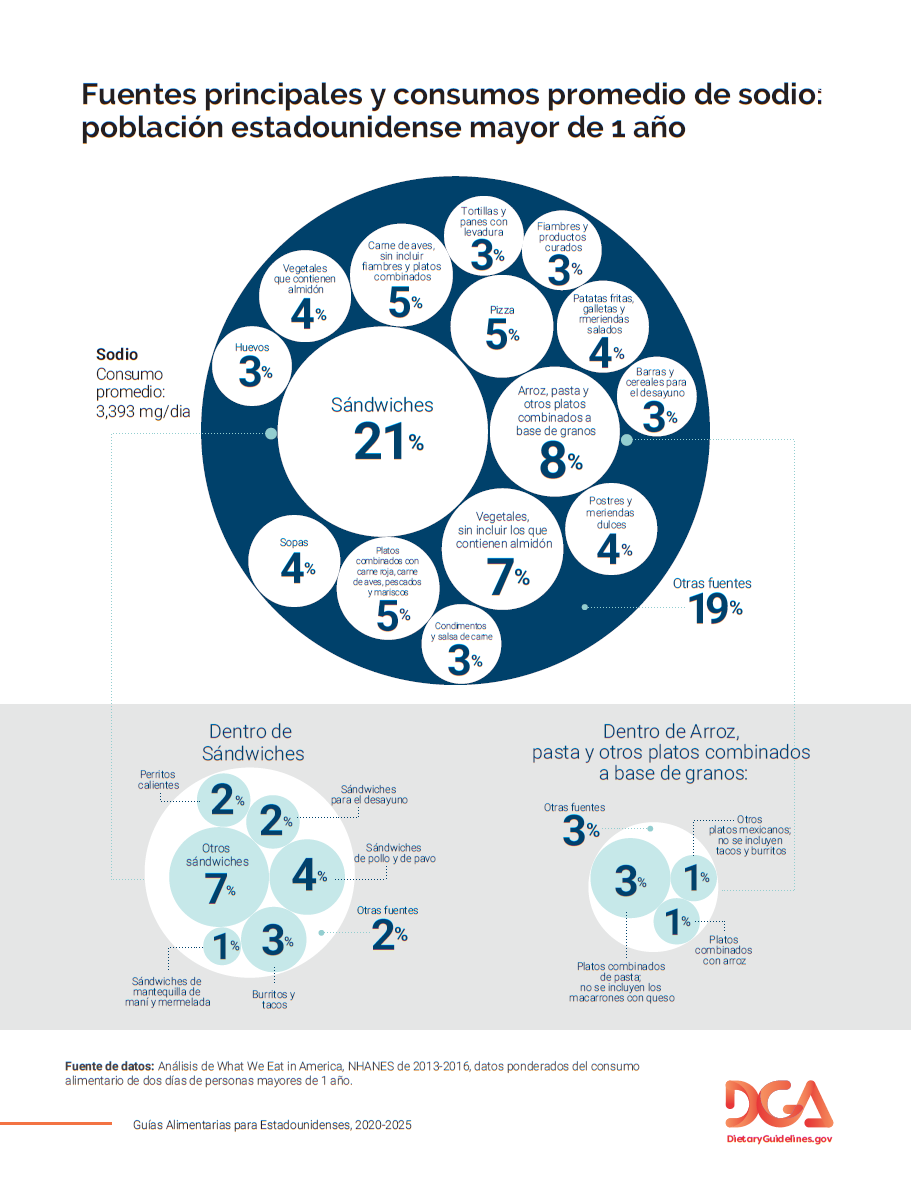
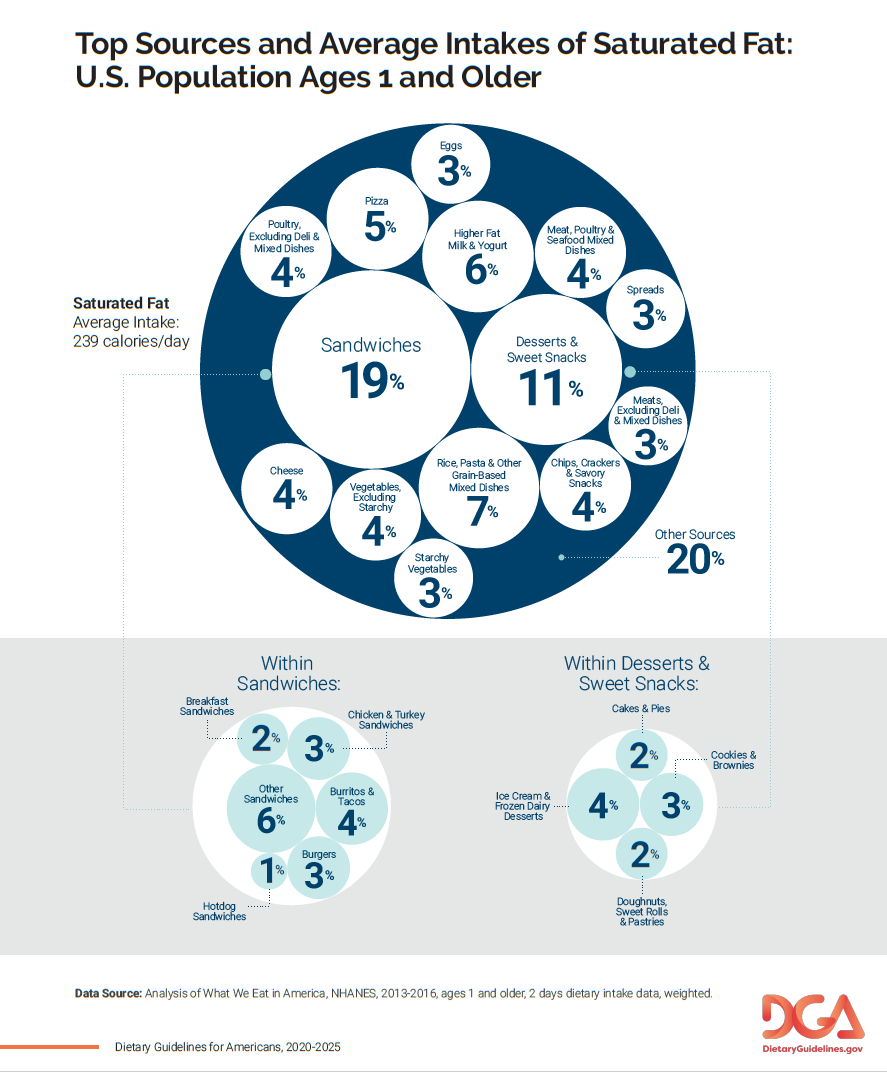
Intakes Top
Sources
Permission to Use Statement
Content from the Dietary Guidelines for Americans, 2020-2025
The Figures on this page and any Graphs, Figures, and Tables within the Dietary Guidelines for Americans, 2020-2025 are in the public domain and may be used without permission. Most Photos and Illustrations included in the document are NOT in the public domain, thus permission cannot be granted for their use or reproduction. However, Photos used in Figures 1-8 and 1-9 are in the public domain and may be used without permission. We ask, however, that if you reproduce this content, either electronically or in print, that you use content as originally designed; that it not be altered or modified; and that it be sourced to the Dietary Guidelines for Americans, 2020-2025. If content is altered or modified, do not source the Dietary Guidelines. Please contact us at dietaryguidelines@usda.gov for further questions.
Suggested Citation
U.S. Department of Agriculture and U.S. Department of Health and Human Services. Dietary Guidelines for Americans, 2020-2025. 9th Edition. December 2020. Available at DietaryGuidelines.gov.
General
Nutrient Density
Healthy Eating Index
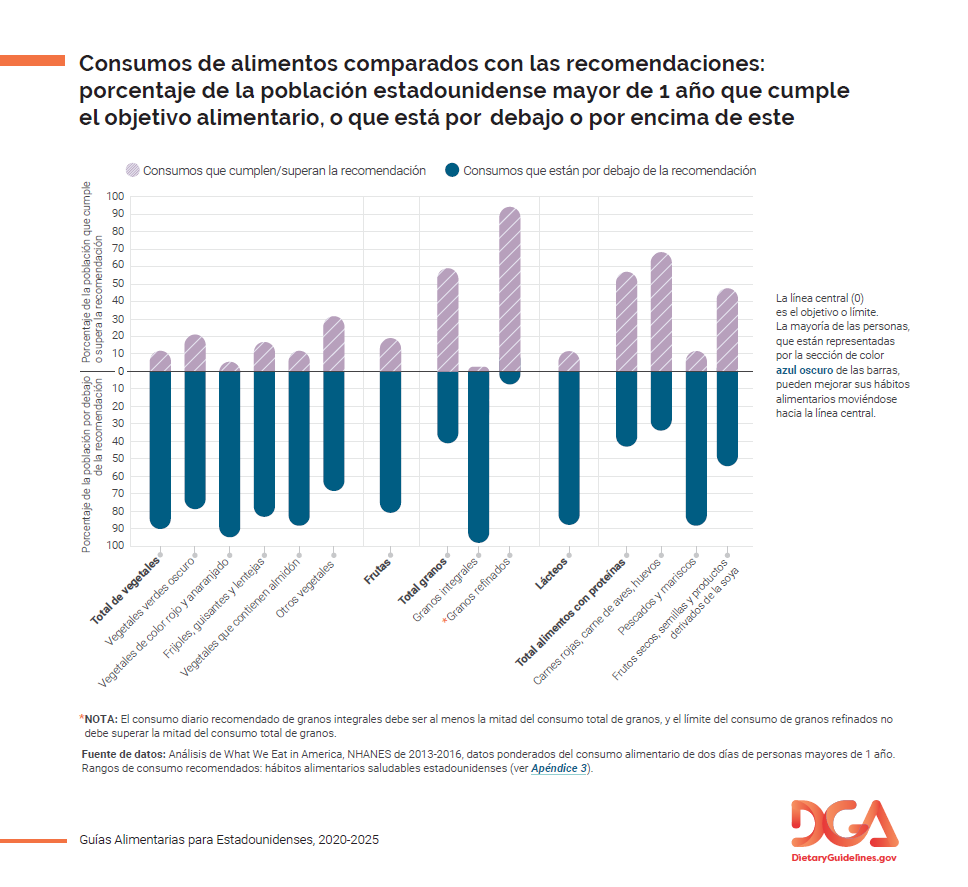
Dietary Intakes Compared to Recommendations by Life Stage
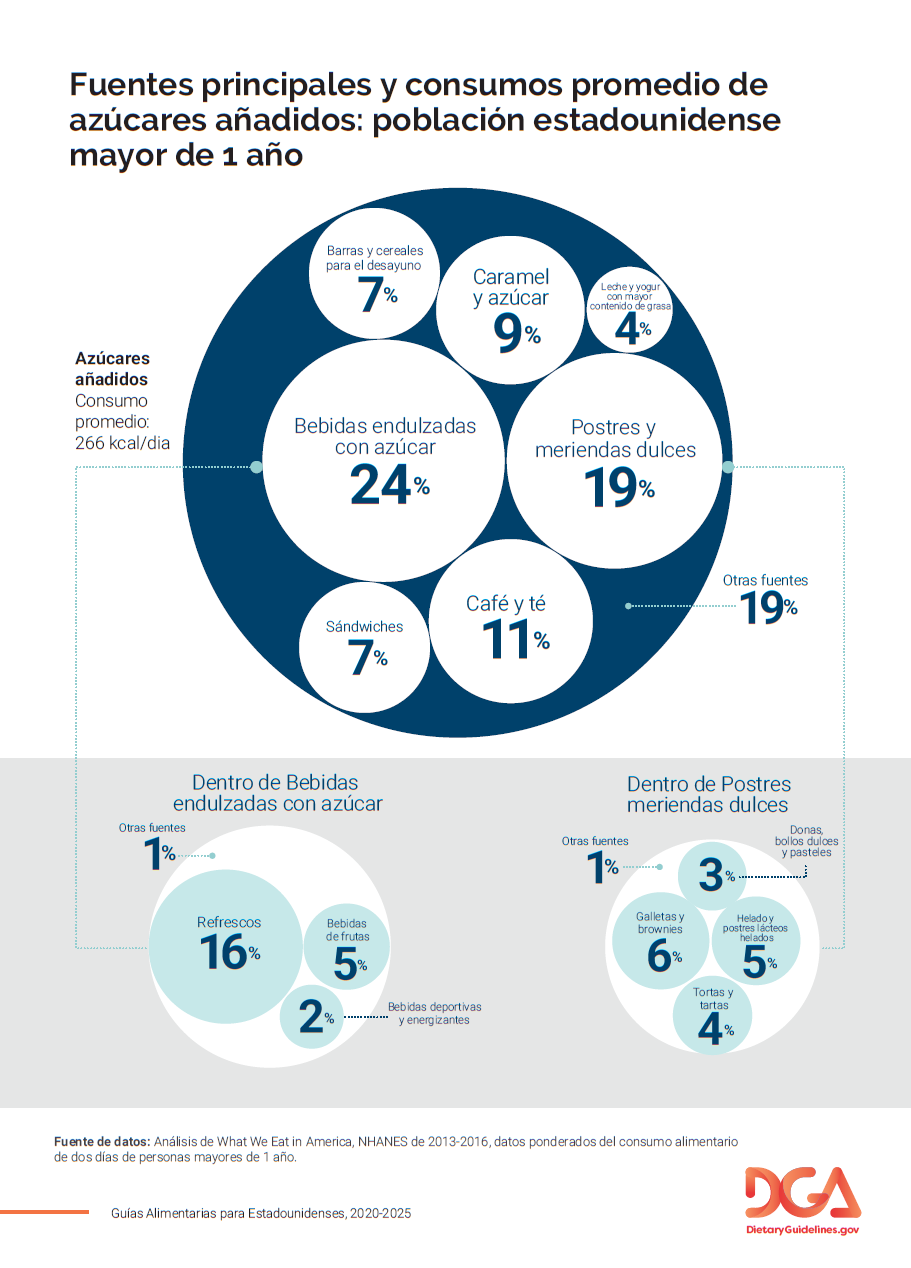
Top Sources of Added Sugars, Saturated Fat, and Sodium
| Looking for infographics? View Infographics |
Return to top |